| RTE Production mix scenarios for 2050 for France | ||||||||
| Source: RTE, Futurs énergétiques 2050 (2021) | ||||||||
| Scenario | Narrative |
Production mix 2050 |
Installed capacity in 2050 (GW)
|
Flexibility mix 2050 |
||||
|---|---|---|---|---|---|---|---|---|
| Solar |
Onshore wind |
Offshore wind |
Existing nuclear |
New nuclear |
||||
| M0 100% EnR en 2050 |
Nuclear phase-out by 2050: the decommissioning of existing nuclear reactors is accelerated, while the pace of development of photovoltaics, wind and marine energy is pushed to its maximum. |
100% / 0% |
~208 GW (x21) 36% |
~74 GW (x4) 31% |
~62 GW 21% |
0 GW 0% |
— |
15 GW 1.7 GW 29 GW 26 GW |
| M1 Répartition diffuse |
Very large-scale development of renewable energies distributed diffusely across the national territory, largely driven by the photovoltaic sector. This growth requires strong mobilisation of local participatory actors and local authorities. |
87% / 13% |
~214 GW (x22) 36% |
~59 GW (x3.5) 23% |
~45 GW 17% |
16 GW 13% |
— |
17 GW 1.7 GW 20 GW 21 GW |
| M23 EnR grands parcs |
Very large-scale development of all renewable energy sectors, driven notably by the installation of large onshore and offshore wind farms. Based on economic optimisation and targeting of technologies and areas with the best yields, enabling economies of scale. |
87% / 13% |
~125 GW (x12) 22% |
~72 GW (x4) 32% |
~60 GW 22% |
16 GW 13% |
— |
15 GW 1.7 GW 20 GW 13 GW |
| N1 EnR + nouveau nucléaire 1 |
Launch of a programme to build new reactors, developed in pairs on existing sites every 5 years from 2035. Sustained development of renewable energies to offset the decommissioning of second-generation reactors. |
74% / 26% |
~118 GW (x11) 22% |
~58 GW (x3.3) 24% |
~45 GW 13% |
16 GW 12% |
~13 GW (8 EPR) 14% |
15 GW 1.7 GW 11 GW 9 GW |
| N2 EnR + nouveau nucléaire 2 |
Launch of a faster programme to build new reactors (one pair every 3 years) from 2035 with progressive ramp-up. Renewable energy development continues but at a slower pace than in the N1 and M scenarios. |
63% / 38% |
~90 GW (x8.5) 17% |
~52 GW (x2.9) 20% |
~36 GW 16% |
16 GW 14% |
~23 GW (14 EPR) 22% |
15 GW 1.7 GW 5 GW 2 GW |
| N03 EnR + nouveau nucléaire 3 |
The production mix is based on equal shares of renewables and nuclear by 2050. This requires operating the existing nuclear fleet as long as possible, and proactively developing diversified new nuclear capacity (EPR 2 + SMR). |
50% / 50% |
~70 GW (x7) 13% |
~43 GW (x2.5) 27% |
~22 GW 13% |
24 GW 23% |
~27 GW (~14 EPR + quelques SMR) 27% |
13 GW 1.7 GW 1 GW 1 GW |
| Common assumptions: hydropower ~22 GW, marine energy 0–3 GW, bioenergy ~2 GW, imports 39 GW, pumped storage 8 GW | ||||||||
| Flexibility mix: Demand flexibility · Vehicle-to-grid · Batteries · Low-carbon thermal | ||||||||
Some Elements on Nuclear Energy
Xavier Timbeau 
Anissa Saumtally
Levelized Cost of Energy (LCOE)
LCOE is the ratio of the (discounted) production of electricity divided by the (discounted) sum of all costs (initial investment, operation and fuel cost, decommission)
From LCOE to final cost for households
Or industry
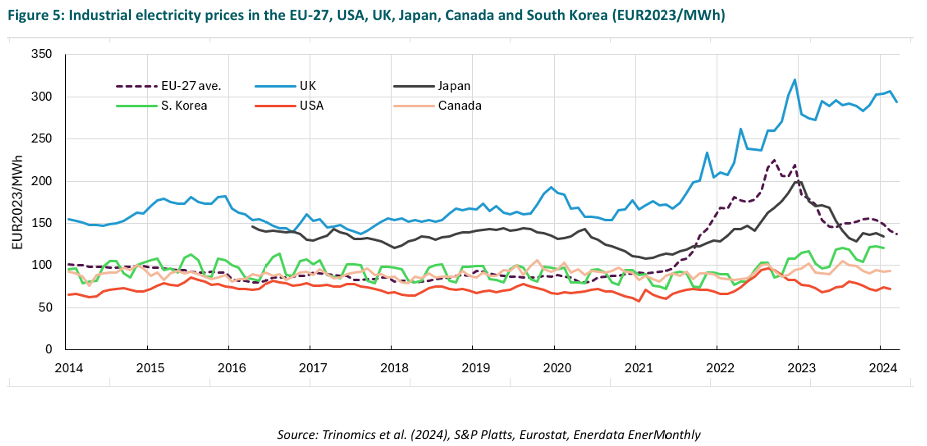
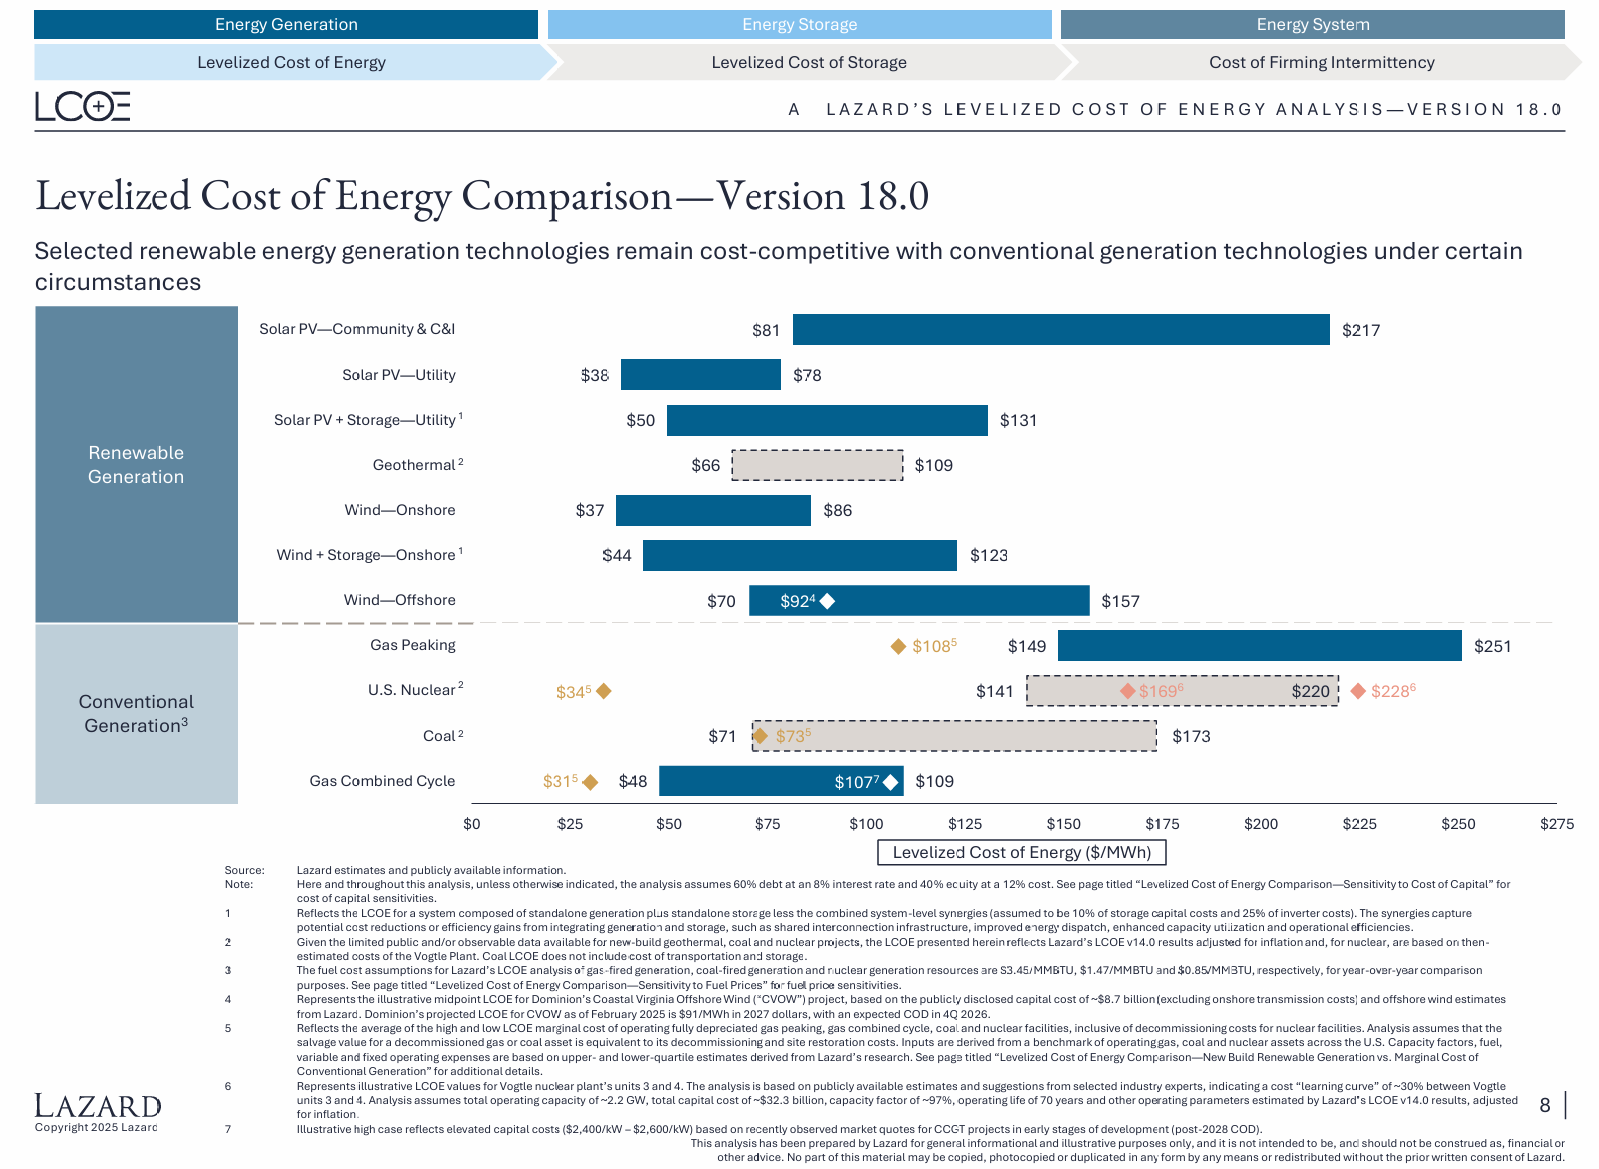
LCOE of main sources
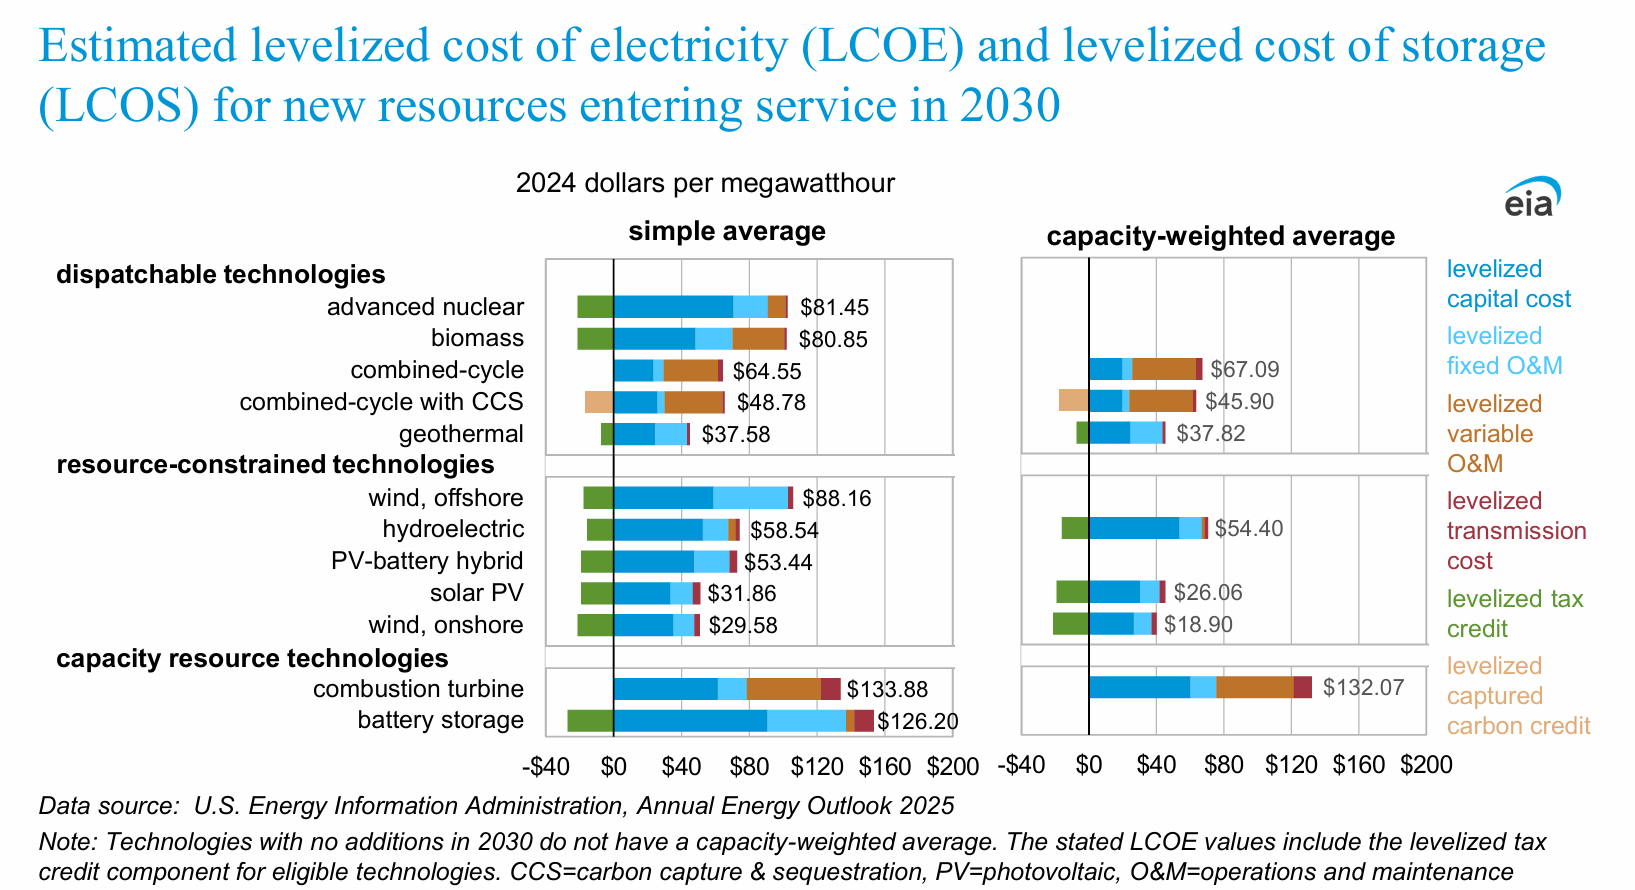
LCOE from the US EIA
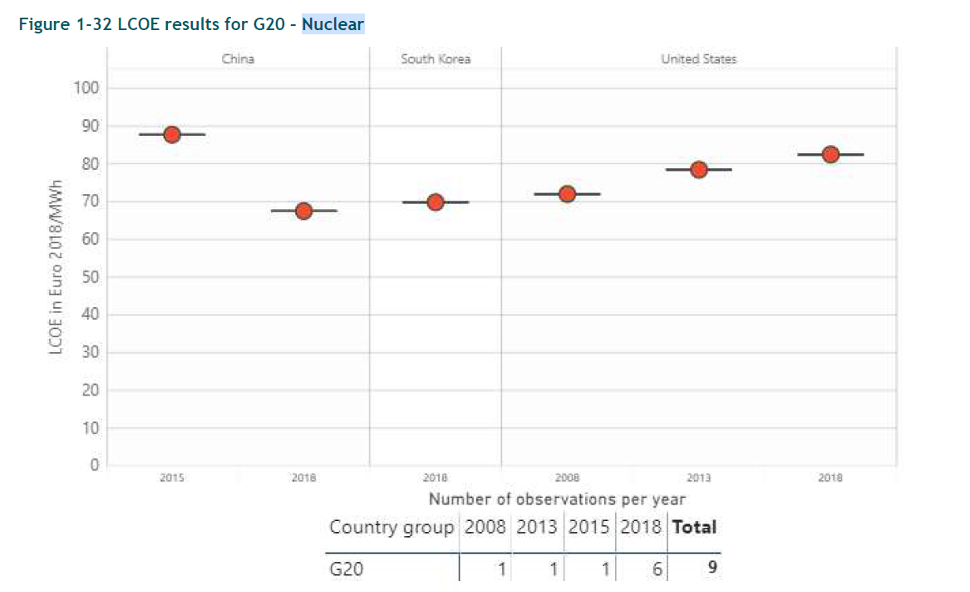
Nuclear Energy Cost
Capacity of Nuclear Energy
| 2024 | 2018 | 2018-2008 | |
|---|---|---|---|
| USA | 103 GW | 104 GW | |
| France | 64 GW | 63 GW | |
| China | 58 GW | 45 GW | +36 GW |
| Japan | 37 GW | 37 GW | |
| Russia | 29 GW | 29 GW | +7.4 GW |
Today, most new nuclear power plants are in China and are from a Russian design (AIE 2025)
Record of installed capacity will be reached in 2025 (high demand of electricity in the US/China)
65 GW in China in 2025, more than France

![]()
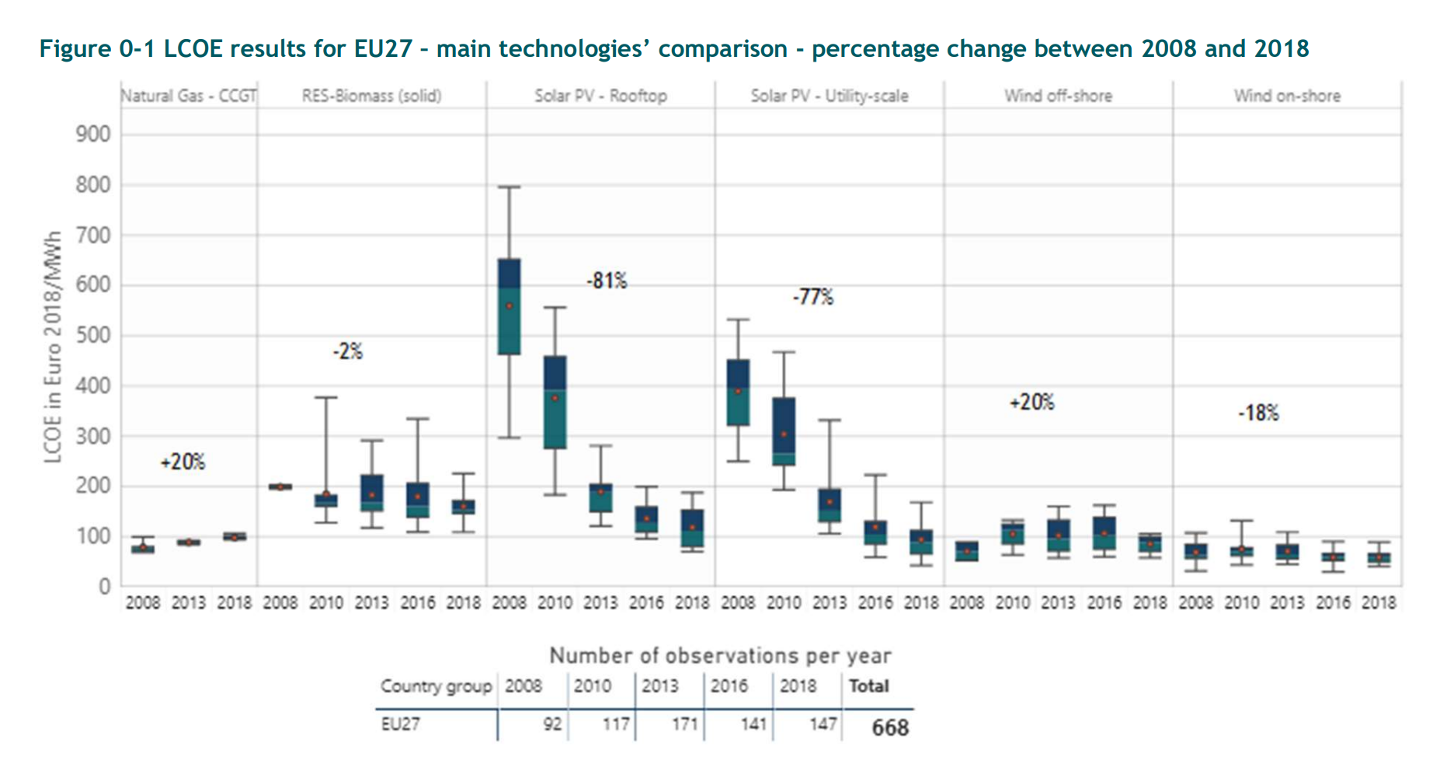
LCOE evolution through time
![]()
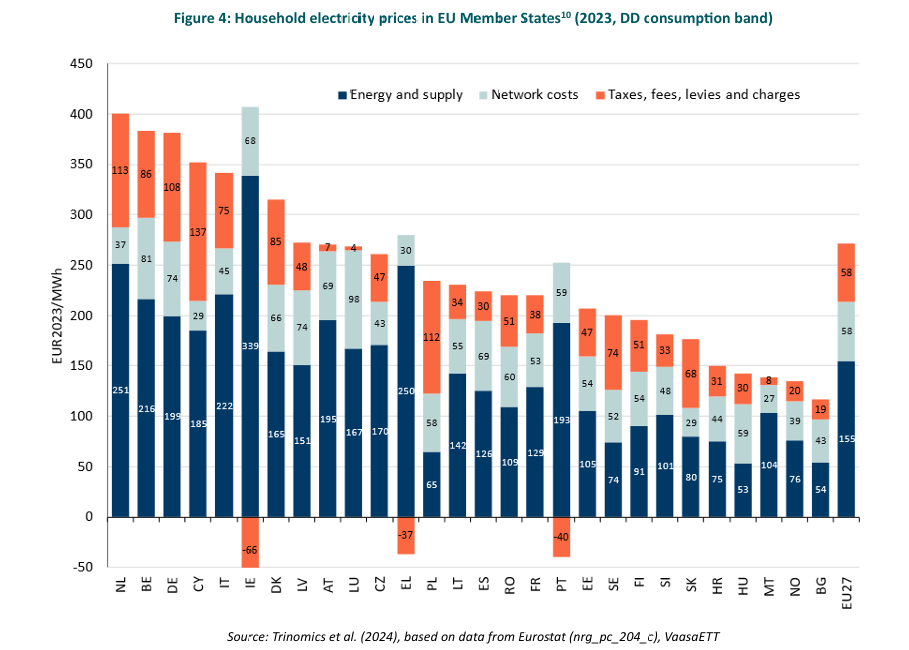
Cost according to RTE
Including all sources, plus storage and demand management plus transportation
![]()
Nuclear Accident
Nuclear accident Fukushima 3/11/2011
- 40m tsunami wave,
- 3 reactors meltdowns of a quite old design power plant (1967 grid 1971)
- 20 000 deaths estimated with the extrapolation (statistical) method
- 4 direct deaths, 1 000 from evacuation stress
- 330 000 evacuated (20km radius)
| B€ | |
|---|---|
| Evacuation | 50 |
| Offsite decont. | 25 to 51 |
| Onsite Decont. | 20 |
| Emergency Power replacement | 73 |
| Loss of property | 200 |
Forbes estimations - $500b+ estimated overall cost (direct and cleaning cost $15b, compensation $60b energy cost ($200b, may double), reconstruction cost $250b) (source Forbes)
![]()
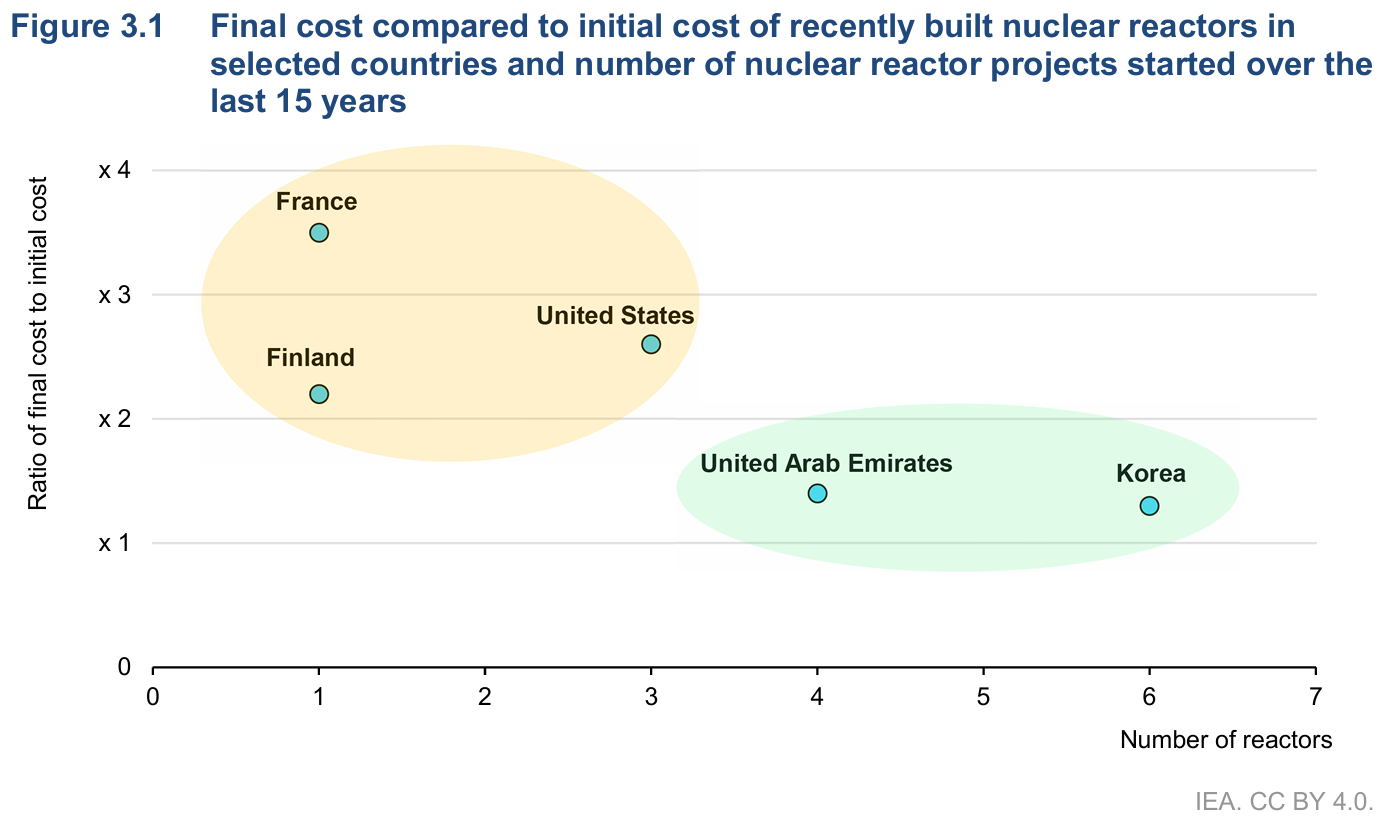
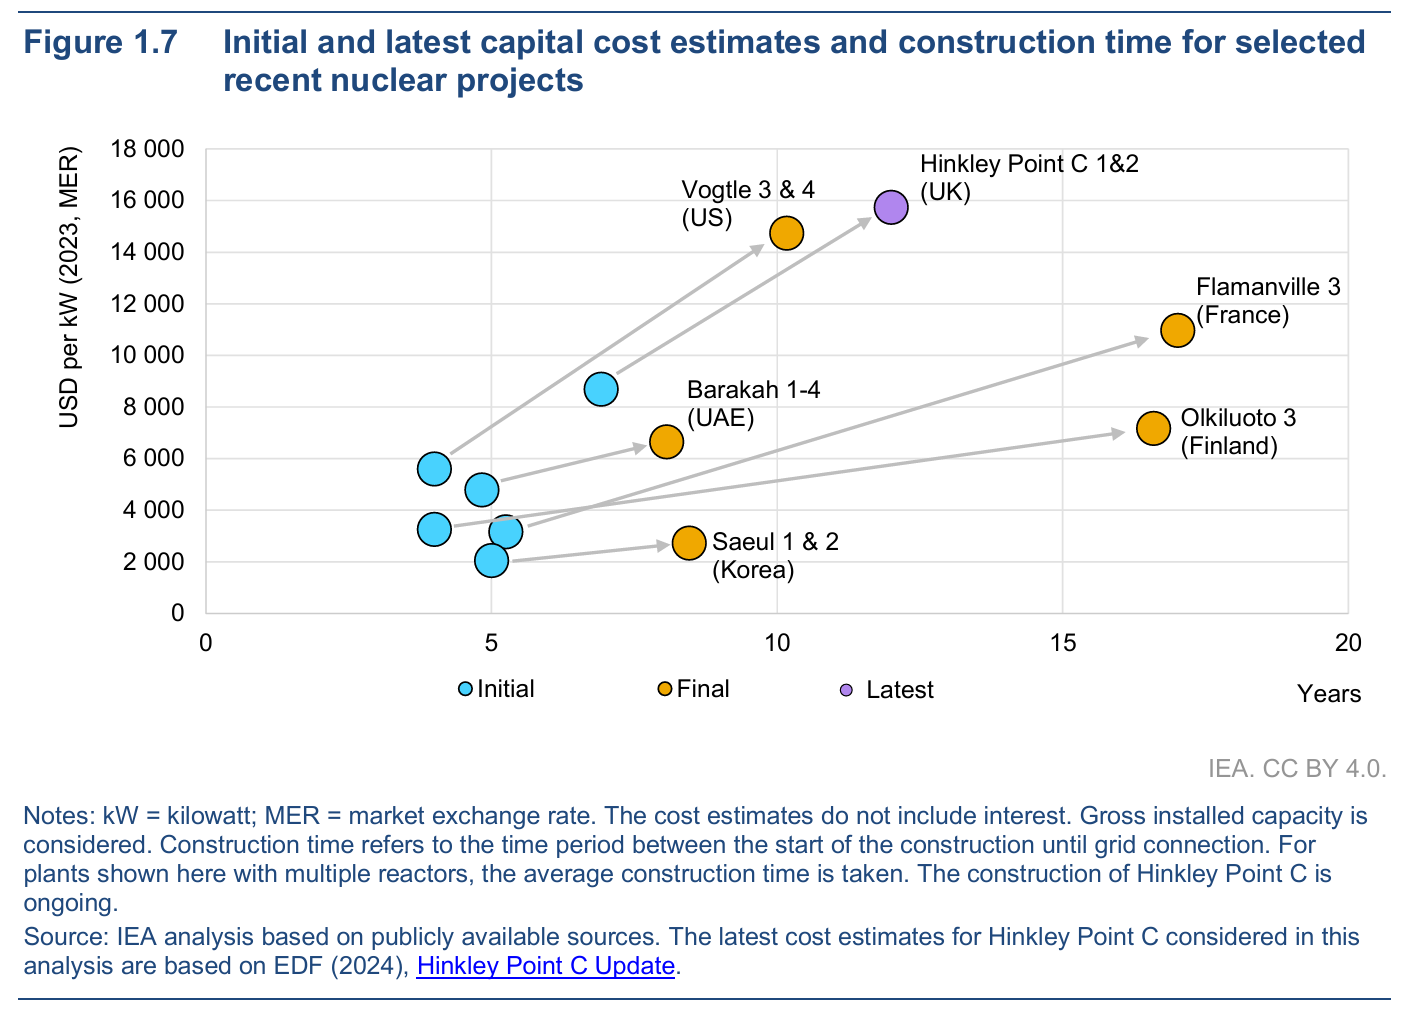
Cost and delays of nuclear energy building cycle
- Flamanville EPR (v1) is estimated to cost 12.1+6.7 (CC) b€ (from 3.3b€)
- Planned for a grid output in 2012, expected mid 2024
- output cost (selling price) reevaluated at 120€/MWh (initially 46€/MWh)
- Olkiluoto 3 estimated at 11b€, 12 years delay (LCOE up to 90-140€/MWh)
- Projected cost for future French EPR is 7 to 8 b€
- Hinkley Point C : 90£/MWh
- China EPR : cost around 7.5b€