CCCC.0: Sources of emissions

GDP versus emissions
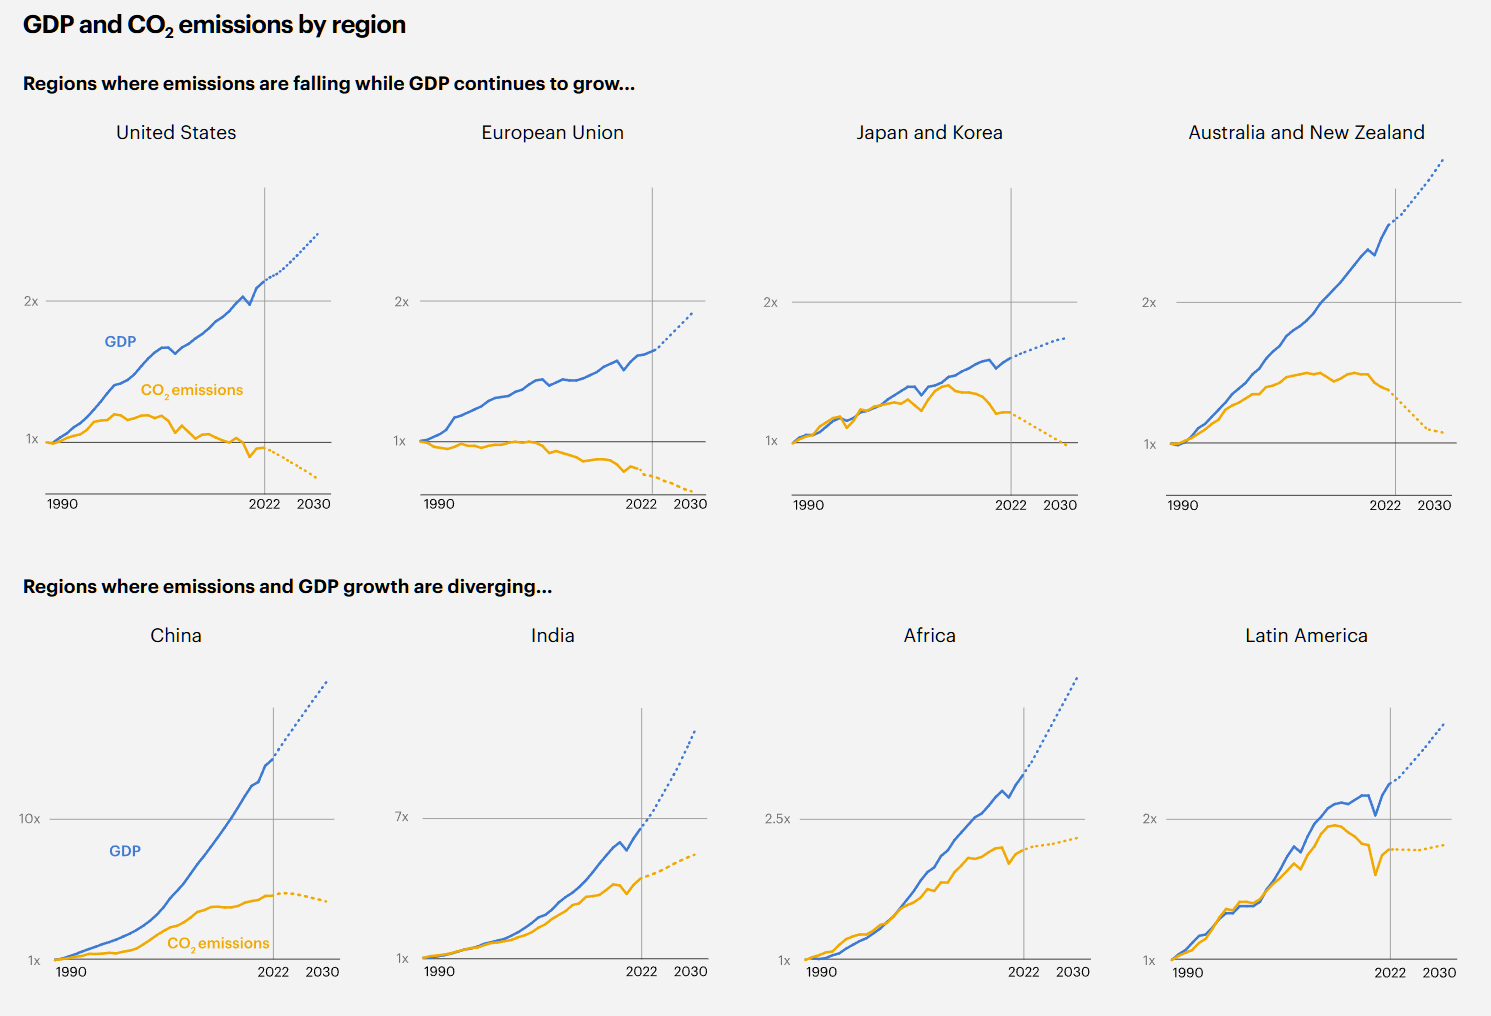
Country GDP and emissions
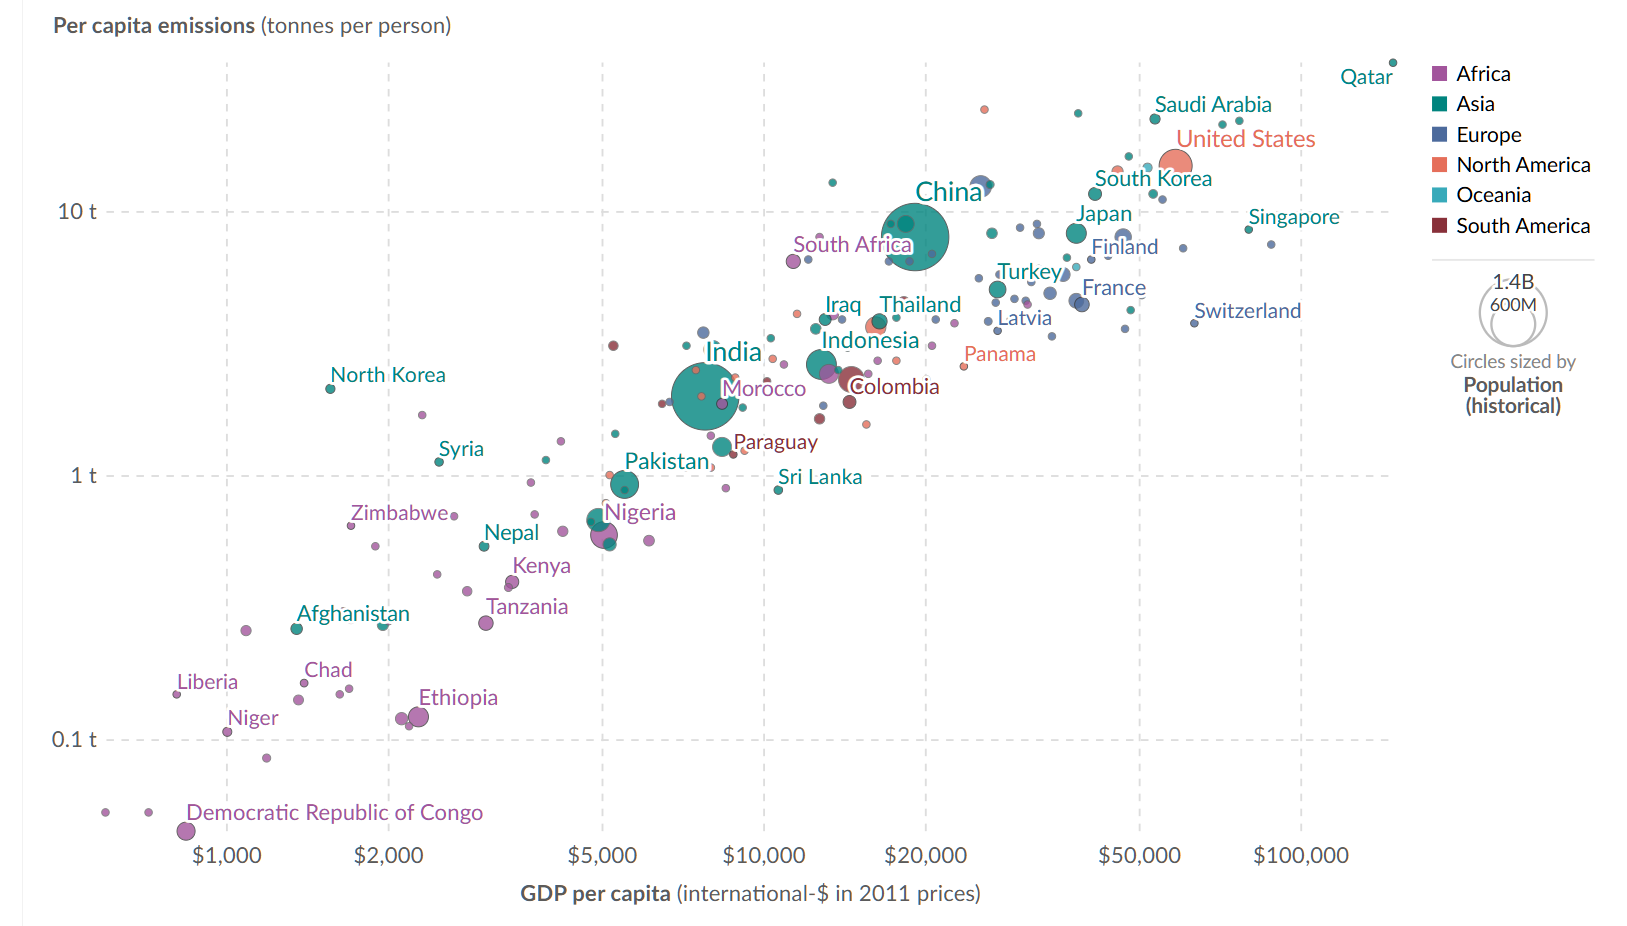
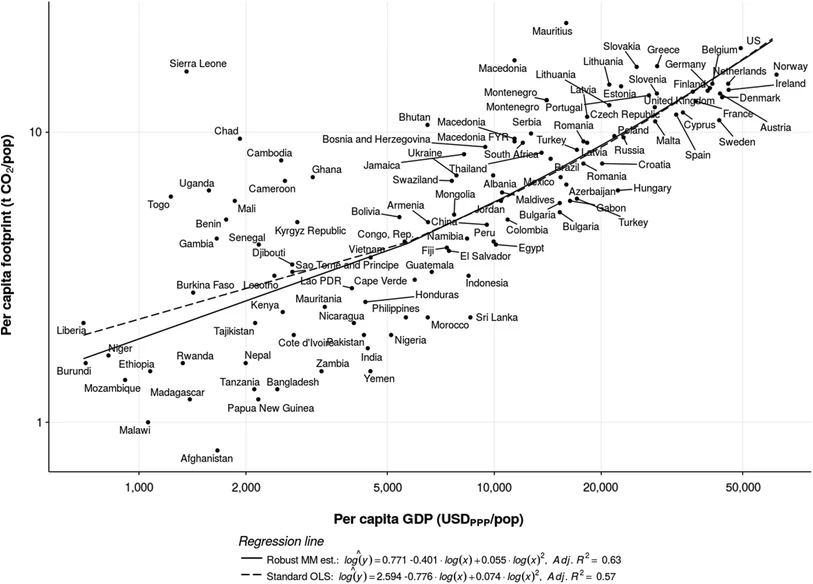
- Among a panel of 70 countries elasticity between income and emissions is .7 10% increase in GDP 7% increase in emissions
Kuznets vs. Okun elasticities
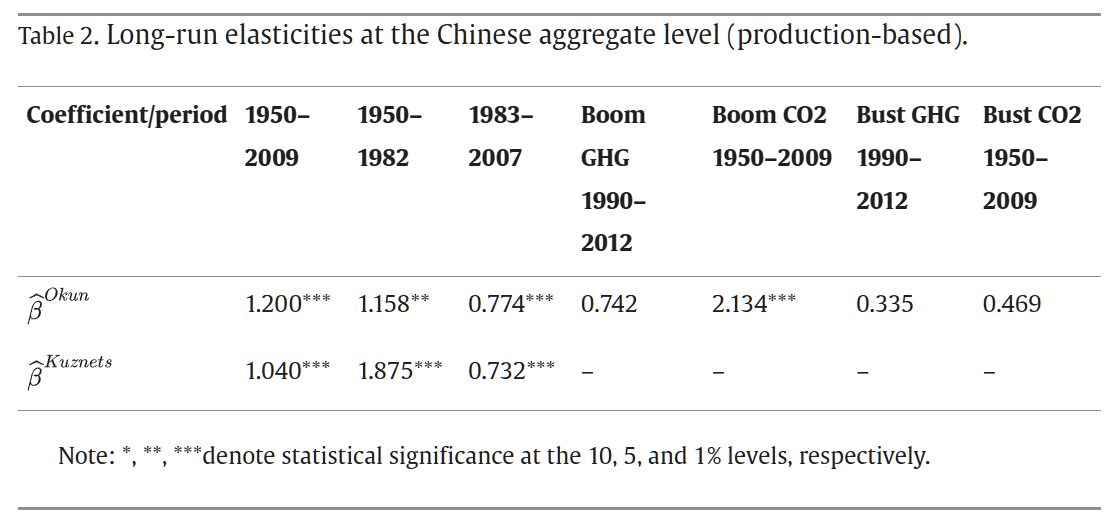
- Making a distinction between cyclical response of emissions to GDP (Okun)
- from long term response (Kuznets)
- strong evidence in both case of a lower than 1 elasticity in the recent period
On world data
Consumer versus producer approach
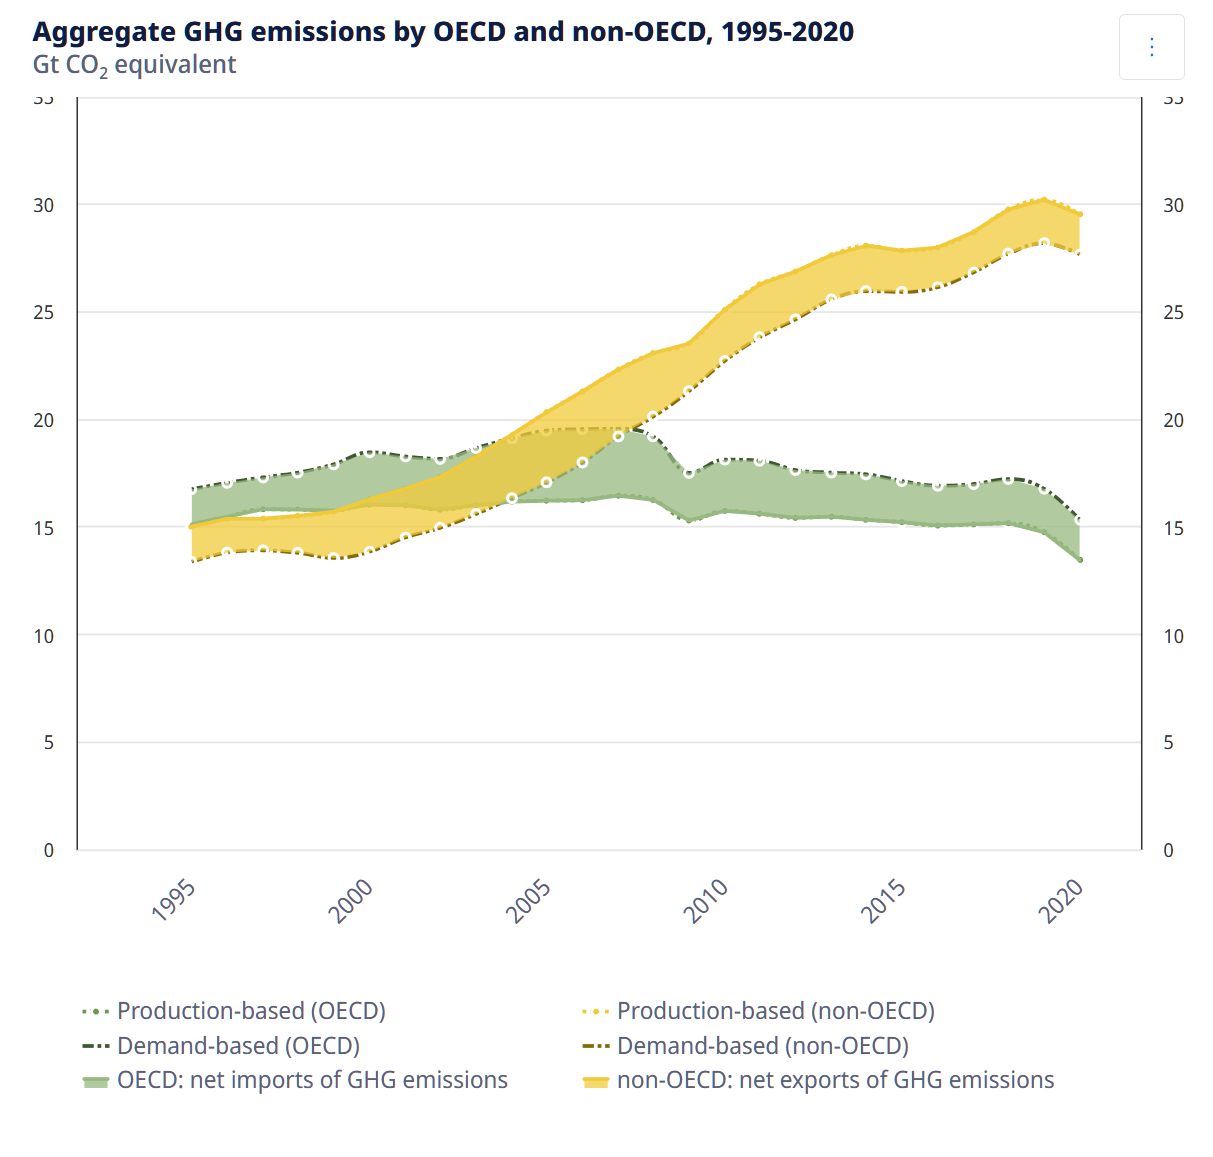
definition: Carbon footprint, amount of carbon dioxide emissions associated with all the activities of a person or other entity.
implies a notion of responsibility: who is responsible? the consumer (end of production) or the producer (means of production).
Carbon footprint, in Inpout Output acceptation, is the emissions of [GHG, CO2] from the consumer point of view, including direct emissions (fuel for a car, heating), indirect emissions (from producing a good or a service, privately or publicly provided) produced nationally or imported Carbon footprints of all consumers add up to total emissions
A carbon footprint can be defined for other entities (firms), but losing additivity (double and no count alike)
- OECD Greenhouse gaz datasets
- Lenzen, Manfred, et Joy Murray. « Conceptualising environmental responsibility ». Ecological Economics, Special Section: Ecological Distribution Conflicts, 70, no2 (15 décembre 2010): 261‑70. https://doi.org/10.1016/j.ecolecon.2010.04.005.
Complexity of energy flows
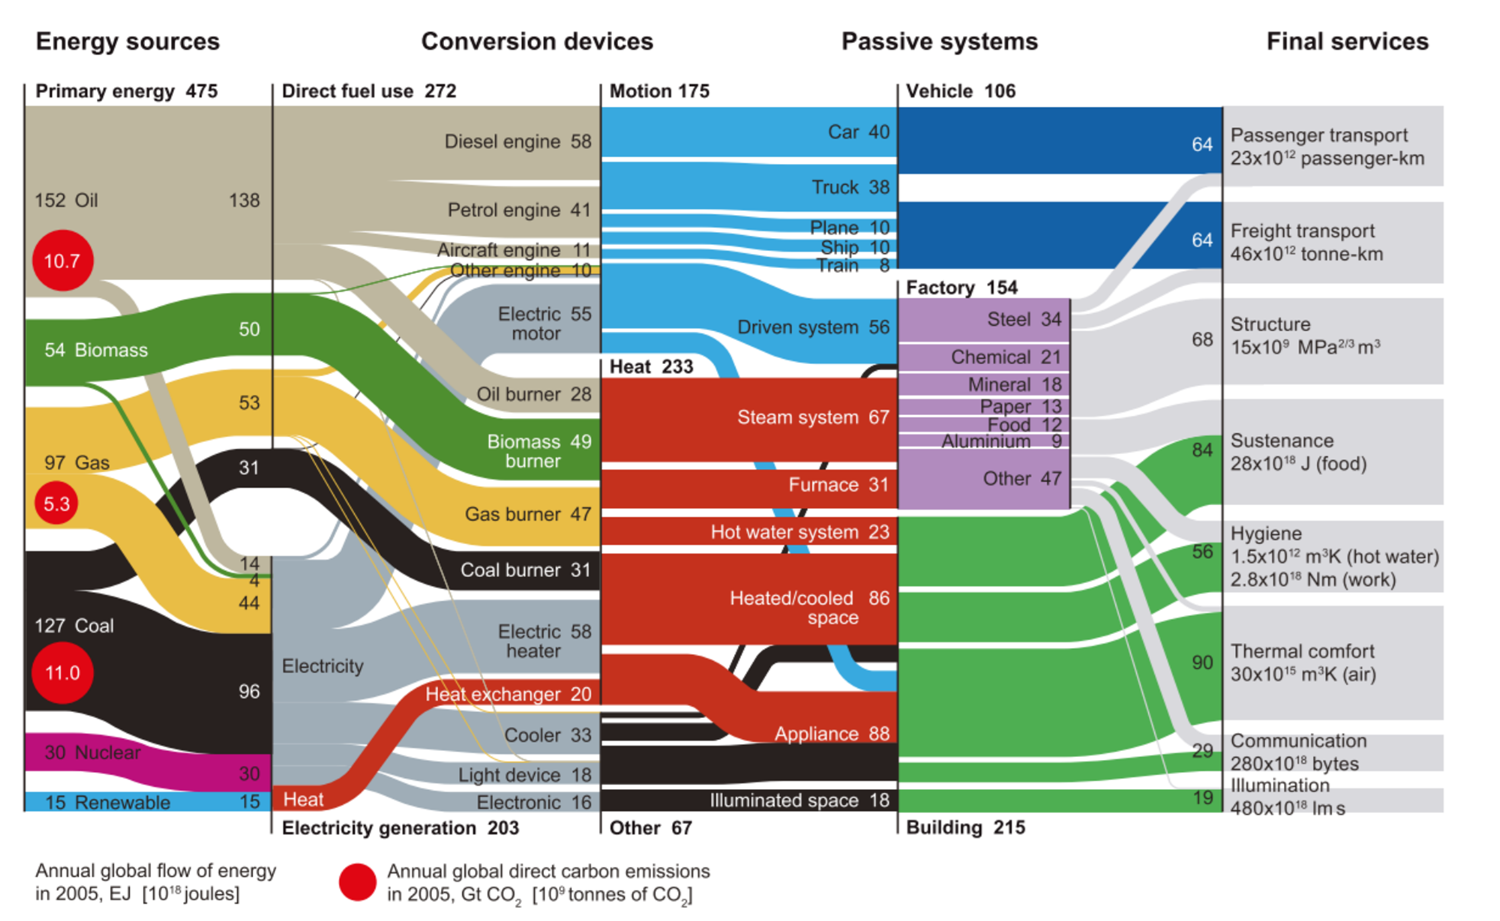
Final Uses
When based on final usage, one can split CO2 emission to usage
- Food accounts for around 15 to 20%
- Shelter maintenance and operation for another 20%
- Mobility is around 20%
- Goods&services production are around 30%
For a sharp reduction of emission, all usages have to reduce
The case for food
- All vegetarian/vegan could reduce food emissions by 30%
- Fat and Amidon/Feculent are the most efficient diet
- Pork/Poultry equivalent to fruits in terms of GHG/kcal
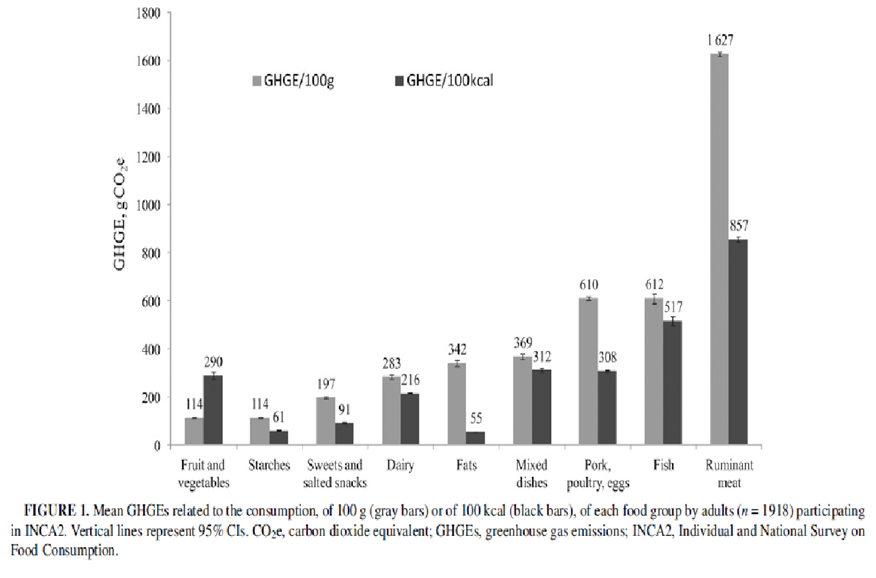
Vieux F., Soler L., Touazi D. and Darmon N., 2013. “High nutritional quality is not associated with low greenhouse gas emissions in self-selected diets of French adults 1 – 3”, (9). doi:10.3945/ajcn.112.035105.

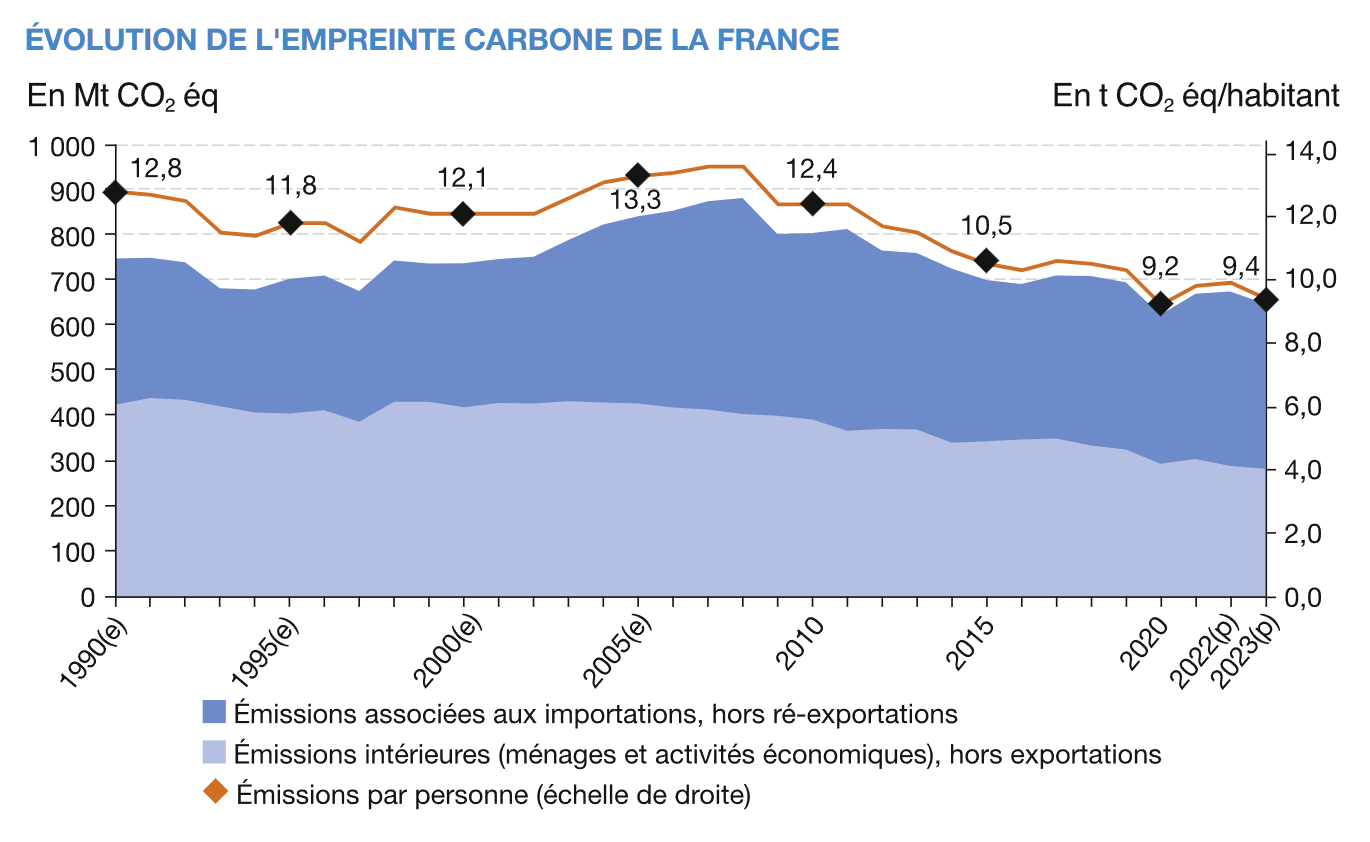
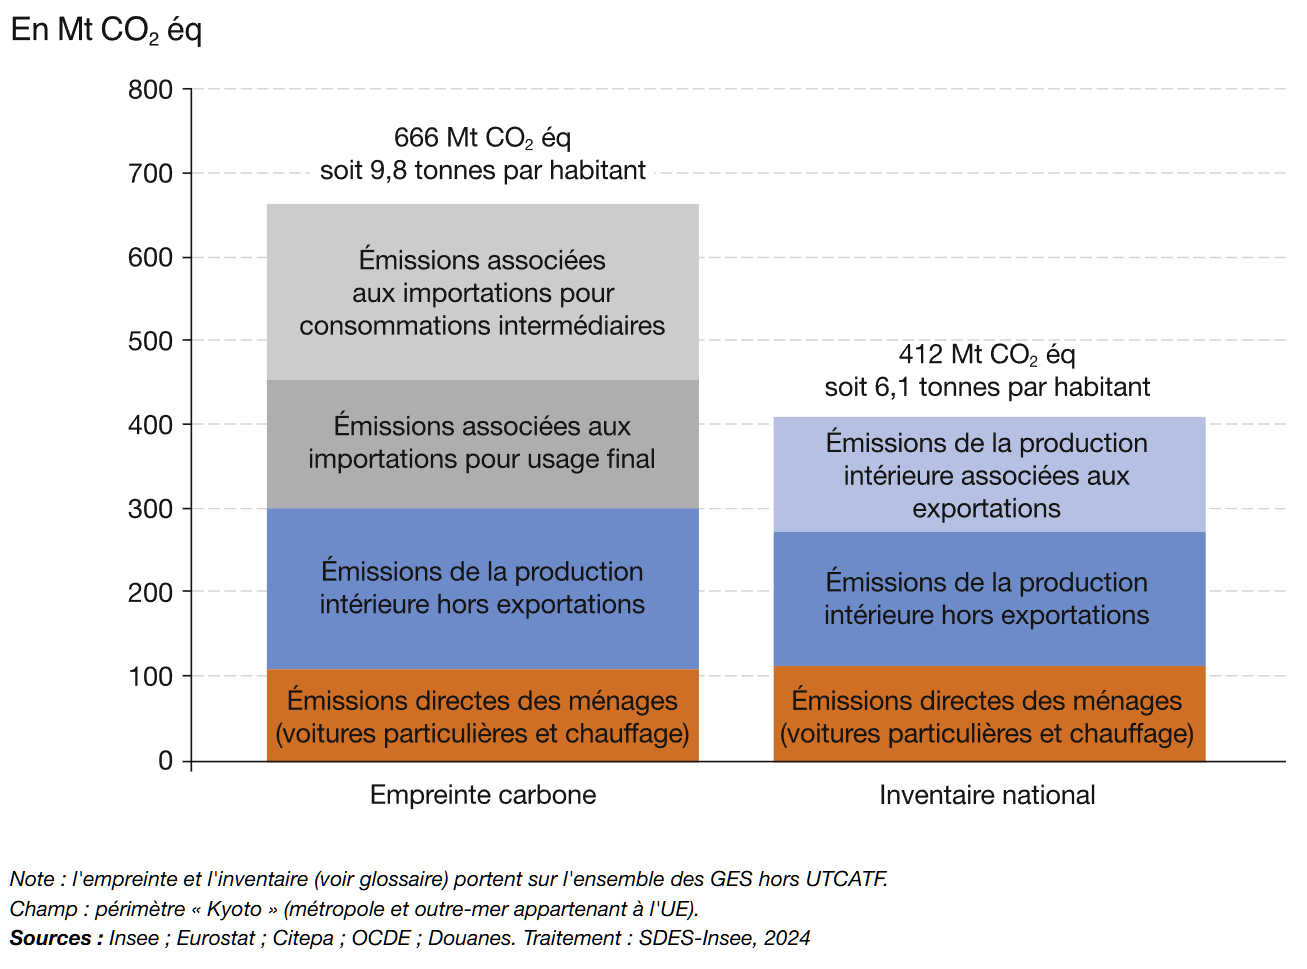
Carbon footprint for France
- France : huge difference between inventory (residential, production) and footprint :::: columns
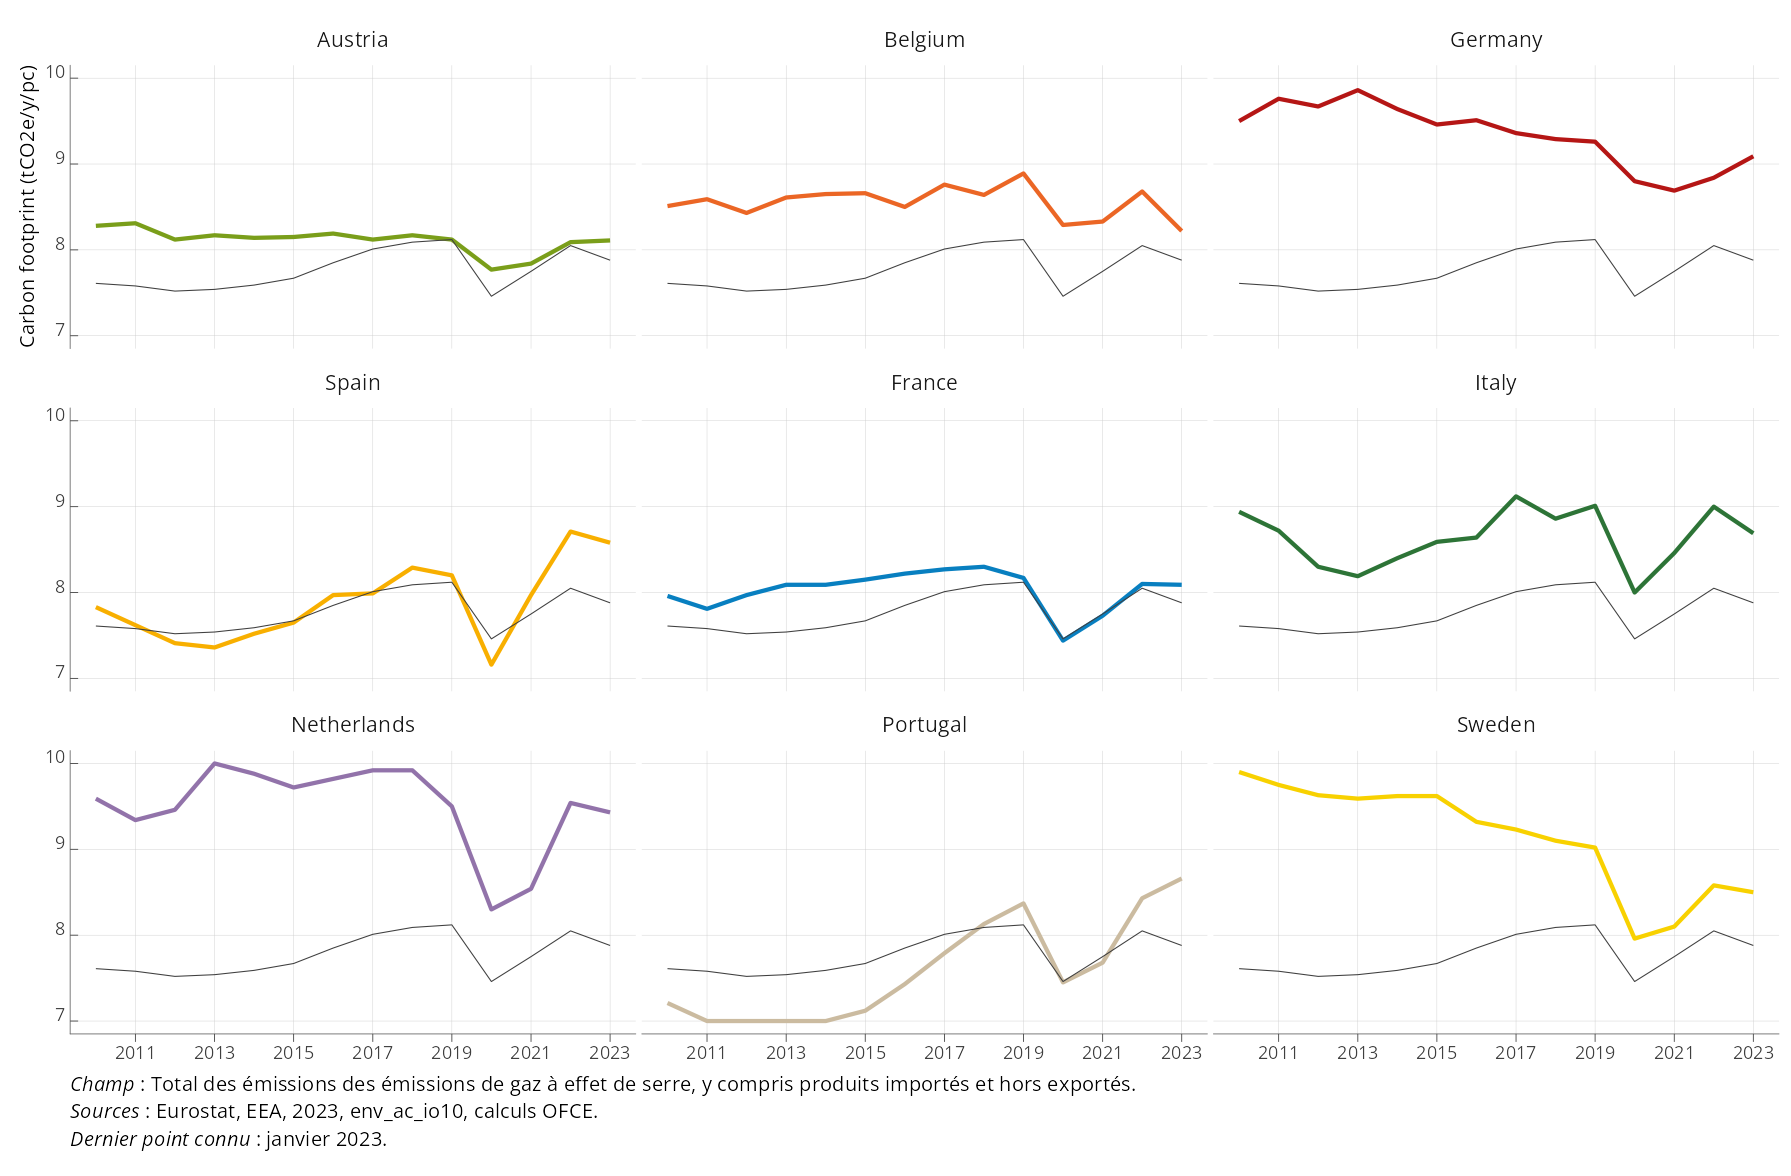
Carbon footprint for Europe (selection)
Chancel Piketty 2015
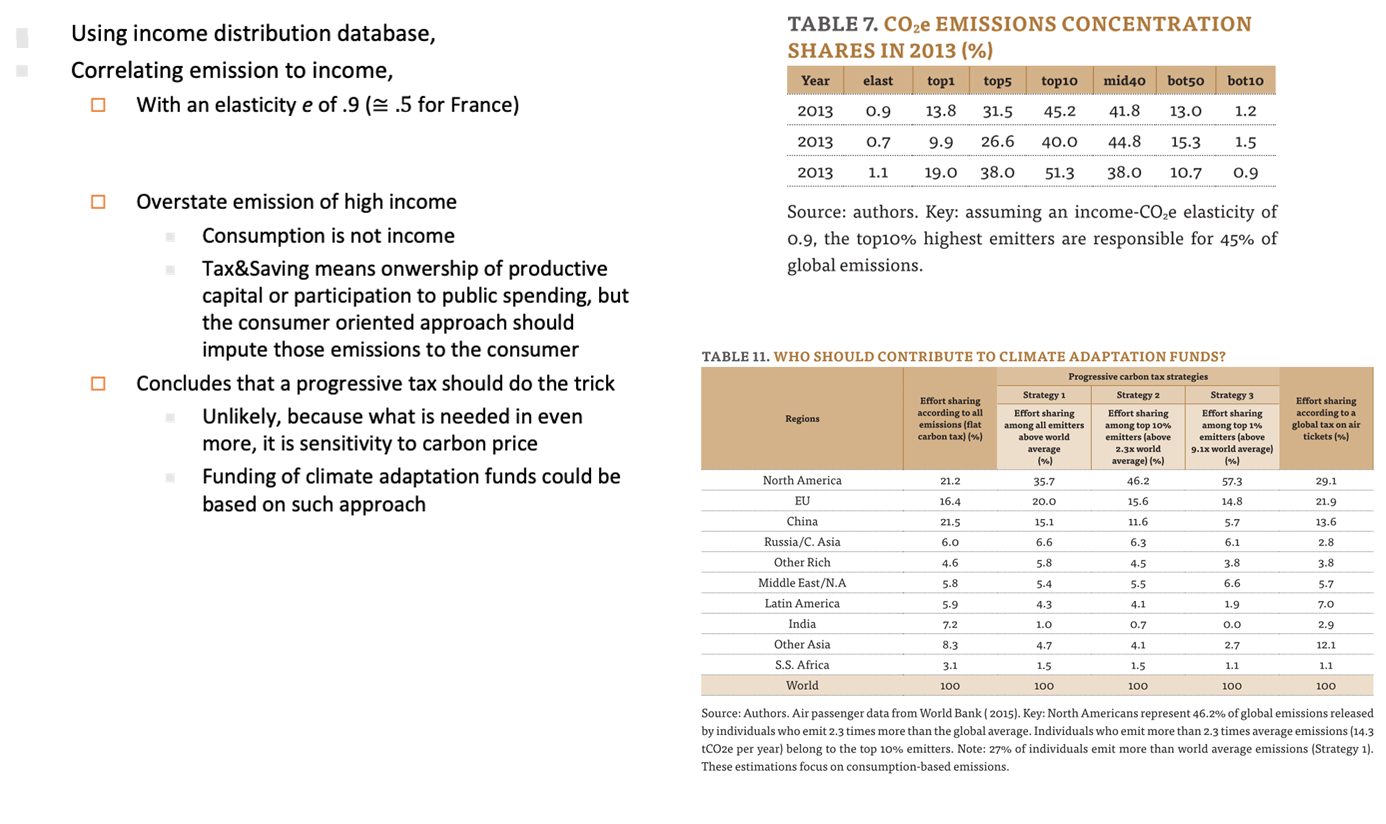
- strong conclusion on who should contribute
- critics: emission elasticity to income of .9 is not convincing
- a billionaire earns 10,000 more than average guy, you can’t emit 100,000 tCO2
- According to Lucas, Kate Perry just emitted 18 tCO2 flying in space, 350 tCO2 if indirect emissions are taken into account
- High end life style could go to a few hundreds tCO2, hardly. $$10 to $$30 average guy.
- one hour helicopter a day (!) 150 tCO2/y
- .9 elasticity to income overstate share of rich people
Beyond income there are other factors
Elasticity (and convention) critical but there is more:
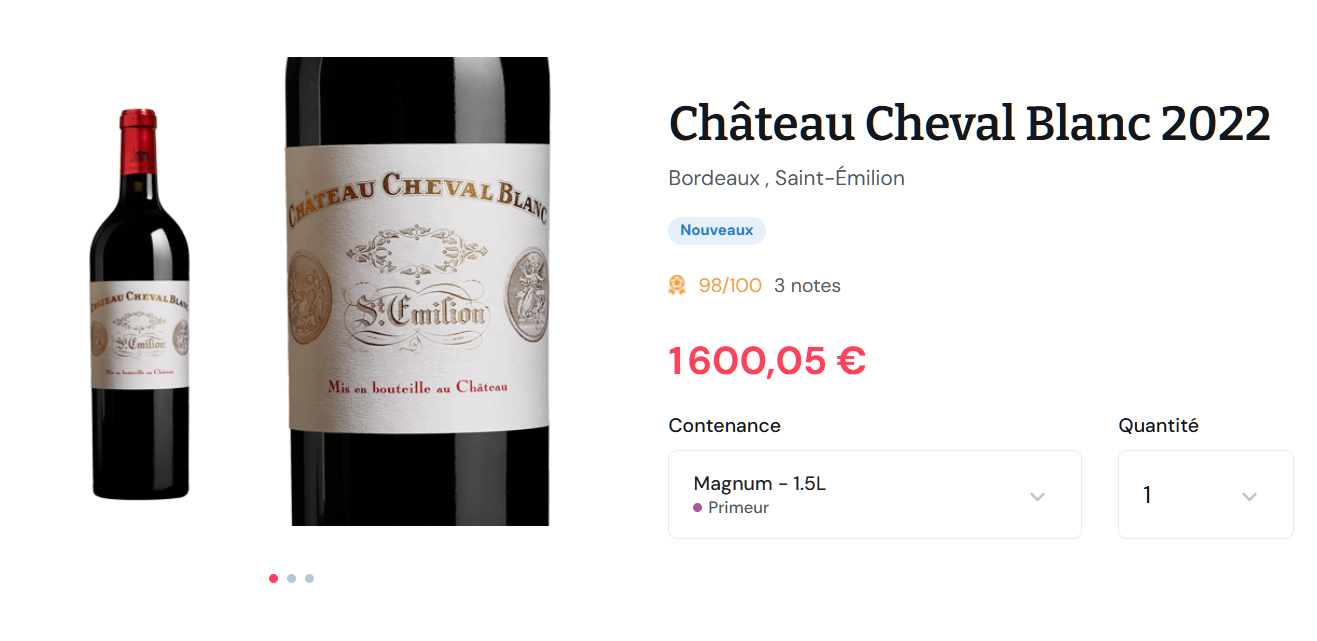
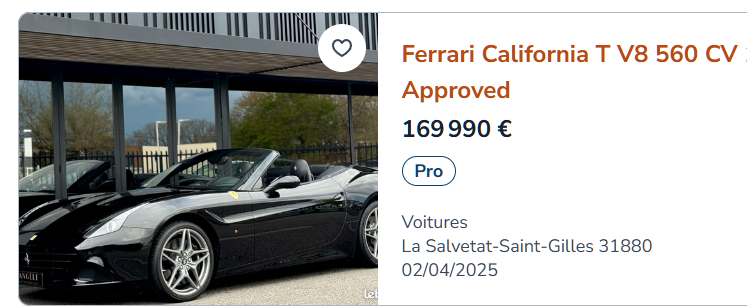
- the Cheval Blanc or Ferrari (Cheval Cabré) or effect
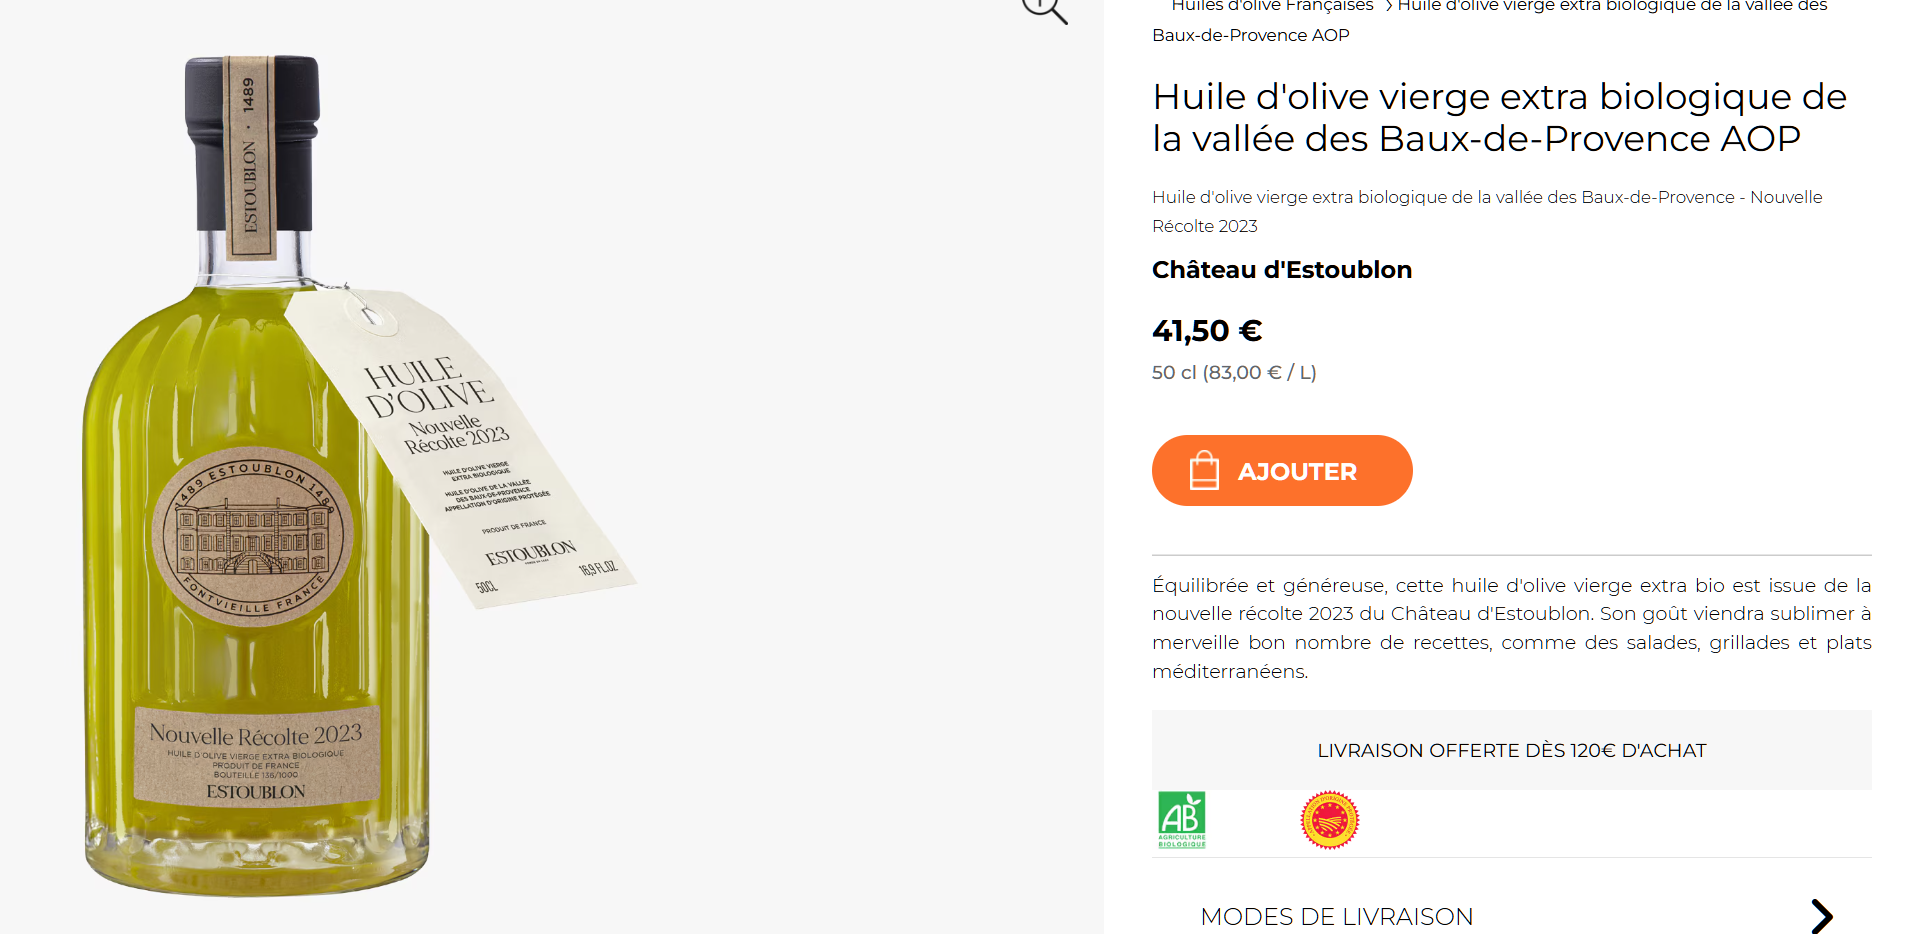
- costs 10 to 100\(\times\) more than your average wine bottle or car or oil
- implies for production the same quantity of CO2 (if not less for organic oil)
- despite higher emission/km, less km done with your ferrari
- Today imputation is made by dividing total emission by value, to get a tCO2 content per €
- by categories of product
- household/individual emission based on (when made seriously) household survey (budget des familles in France), with a tCO2 per euro content (such as base Empreinte from Ademe) except for direct emissions (car fuel, shelter energy consumption)
- works well only for … plane: from economy to business and even private jet, fare price reflects mostly fuel costs
- for all other goods (80% of the carbon footprint), it is all wrong for distribution!
- How to solve that? register all consumption volume (kg) for a large spectrum of qualities (cars, food, smartphones) and use mass measurement instead of value
- Or establish a way to measure emission for each products, following the chain value (making a nuance between organic apple juice from your local producer from orange juice with high water consumption from Florida, boat transported)