


| Taxation | Cap'n Trade | Command&Control |
|---|---|---|
| Cost effectiveness | ||
| Yes, under condition | Yes under conditions: | No, very different implicit prices |
| If applied to all, with same price | If applied to all (high t.c.) | Unless cost & transaction costs are low |
| No free allowances | ||
| Uncertainty of cost uncertainty of quantities | ||
| Superior in simple framework, as quantities are a stock | Inferior, but quantités are a stock and investment is also | Very (too?) flexible, |
| Price stability is key to long term decision | Second order depends on comparative slope of marginal cost and marginal benefit | Long term efficiency (through banning) |
| Central bank type monitoring of market can stabilze price and mimick tax | ||
| Governance | ||
| Tax legislation, in the hand of finance committee in parliament, not green usually | Specific legislation committees | Very specific legislation up to arbitrary and opaque decisions |
| Use of receipts symbolically important (not relevant however) | no unanimity needed in the EU | open to lobby influence, hard to commit in the long term |
| very flexible to changes in technology | ||
| International agreements | ||
| In the UE tax legislation requires unanimity | international agreement and linkage possible | National only except trhough norms applied to imported products |
| International binding agreements impossible due to principle fiscal sovereignty | Free allowances can induce carbon leakage (hard to compensate with BTA) | |
| BTA | ||
| Possibility of capture or fraud | ||
| Strong institutions for tax compliance | Market manipulation possible, but not likely to be an issue | Impossible to equilibrate pressure |
| Manipulation of outcomes | ||
| Principle of equal taxation | Frauds due to different juridictions and linkage | Monitoring costs and frauds high |
| Small number of units under trade scheme, caputure by lobbies likely (similar to interbank market) | ||
| Inter state compensation (hot air) | ||
| Information, monitoring and compensation | ||
| Low costs if taxation is upstream for CO2 emissions | Low for large units, nearly impossible for small ones – taxes and t&c must coexist | Very difficult to monitor |
| High if monitoring is downstream | International markets raise taxation cooperation issues and free rider with another policies interactions | Compensation at the cost of higher emissions (tradeoff between target and compensation) |
| Compensation is difficult (downstream, high information and monotoring cost) or compensation is lumpsum kind (average compensation, double dividend) | Upstream compensation very easy | |
| Heterogenity | ||
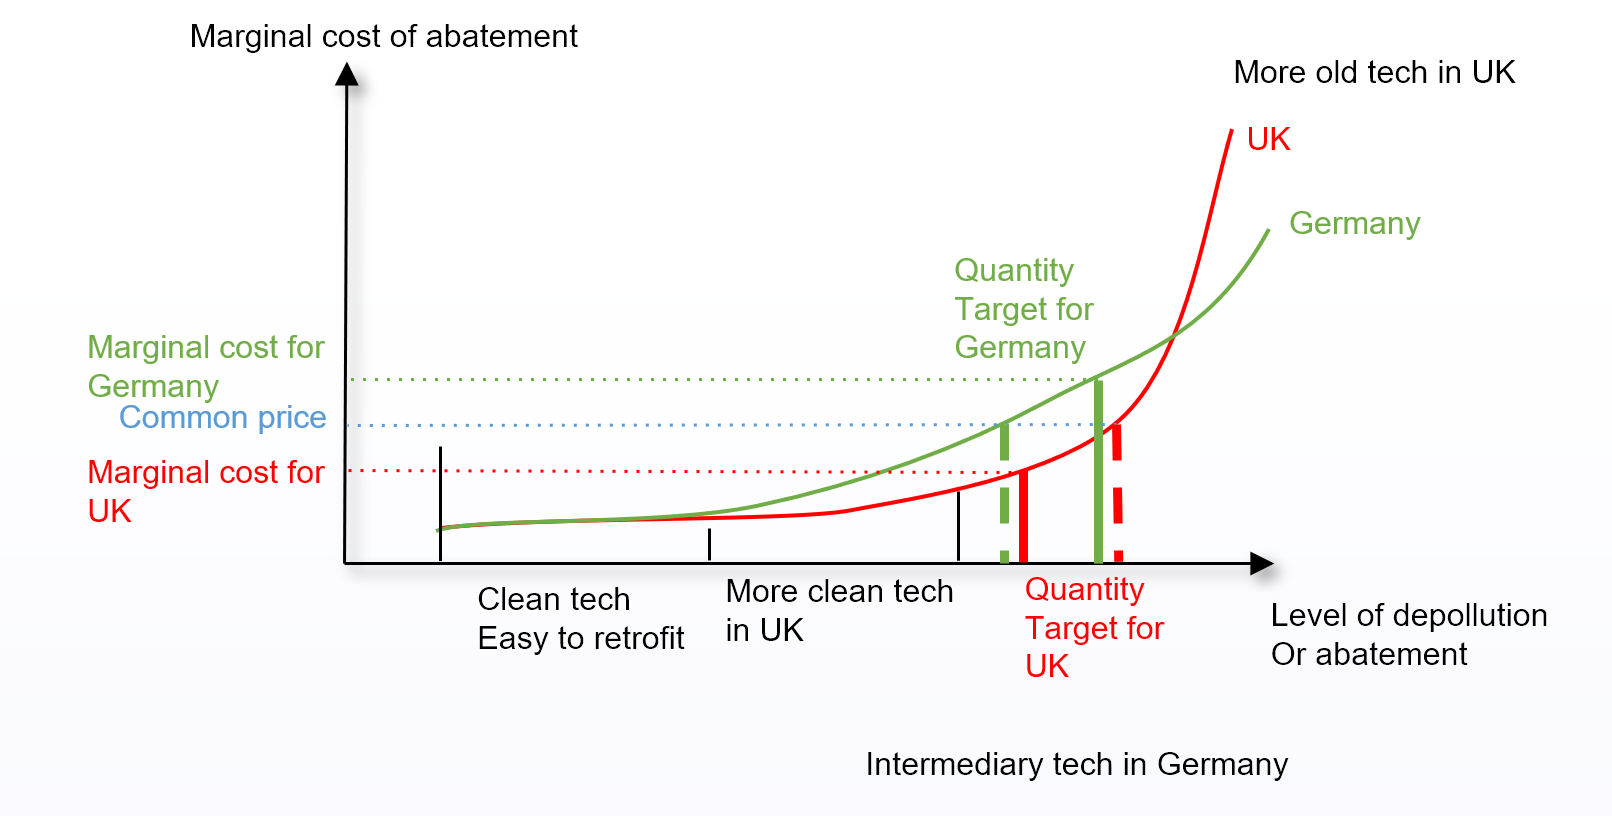
| One size fits all | Easily reveal social cost | Very suited to tailored policies, with efficiency loss unquantifiable |
| Potentially corrected with BTA, with loss of efficiency | Limit extreme pressure on high polluters | |
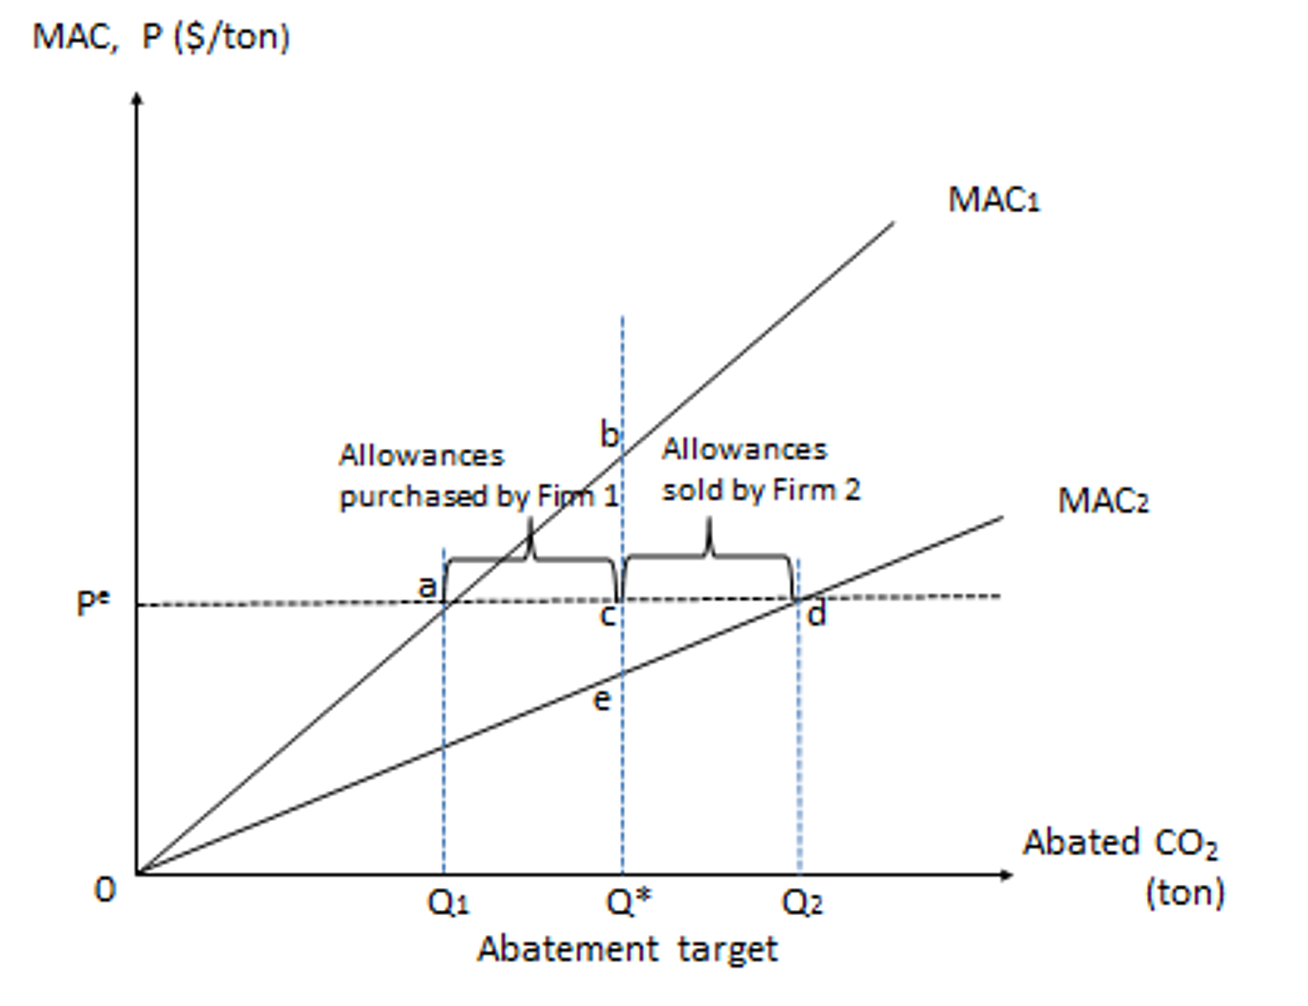
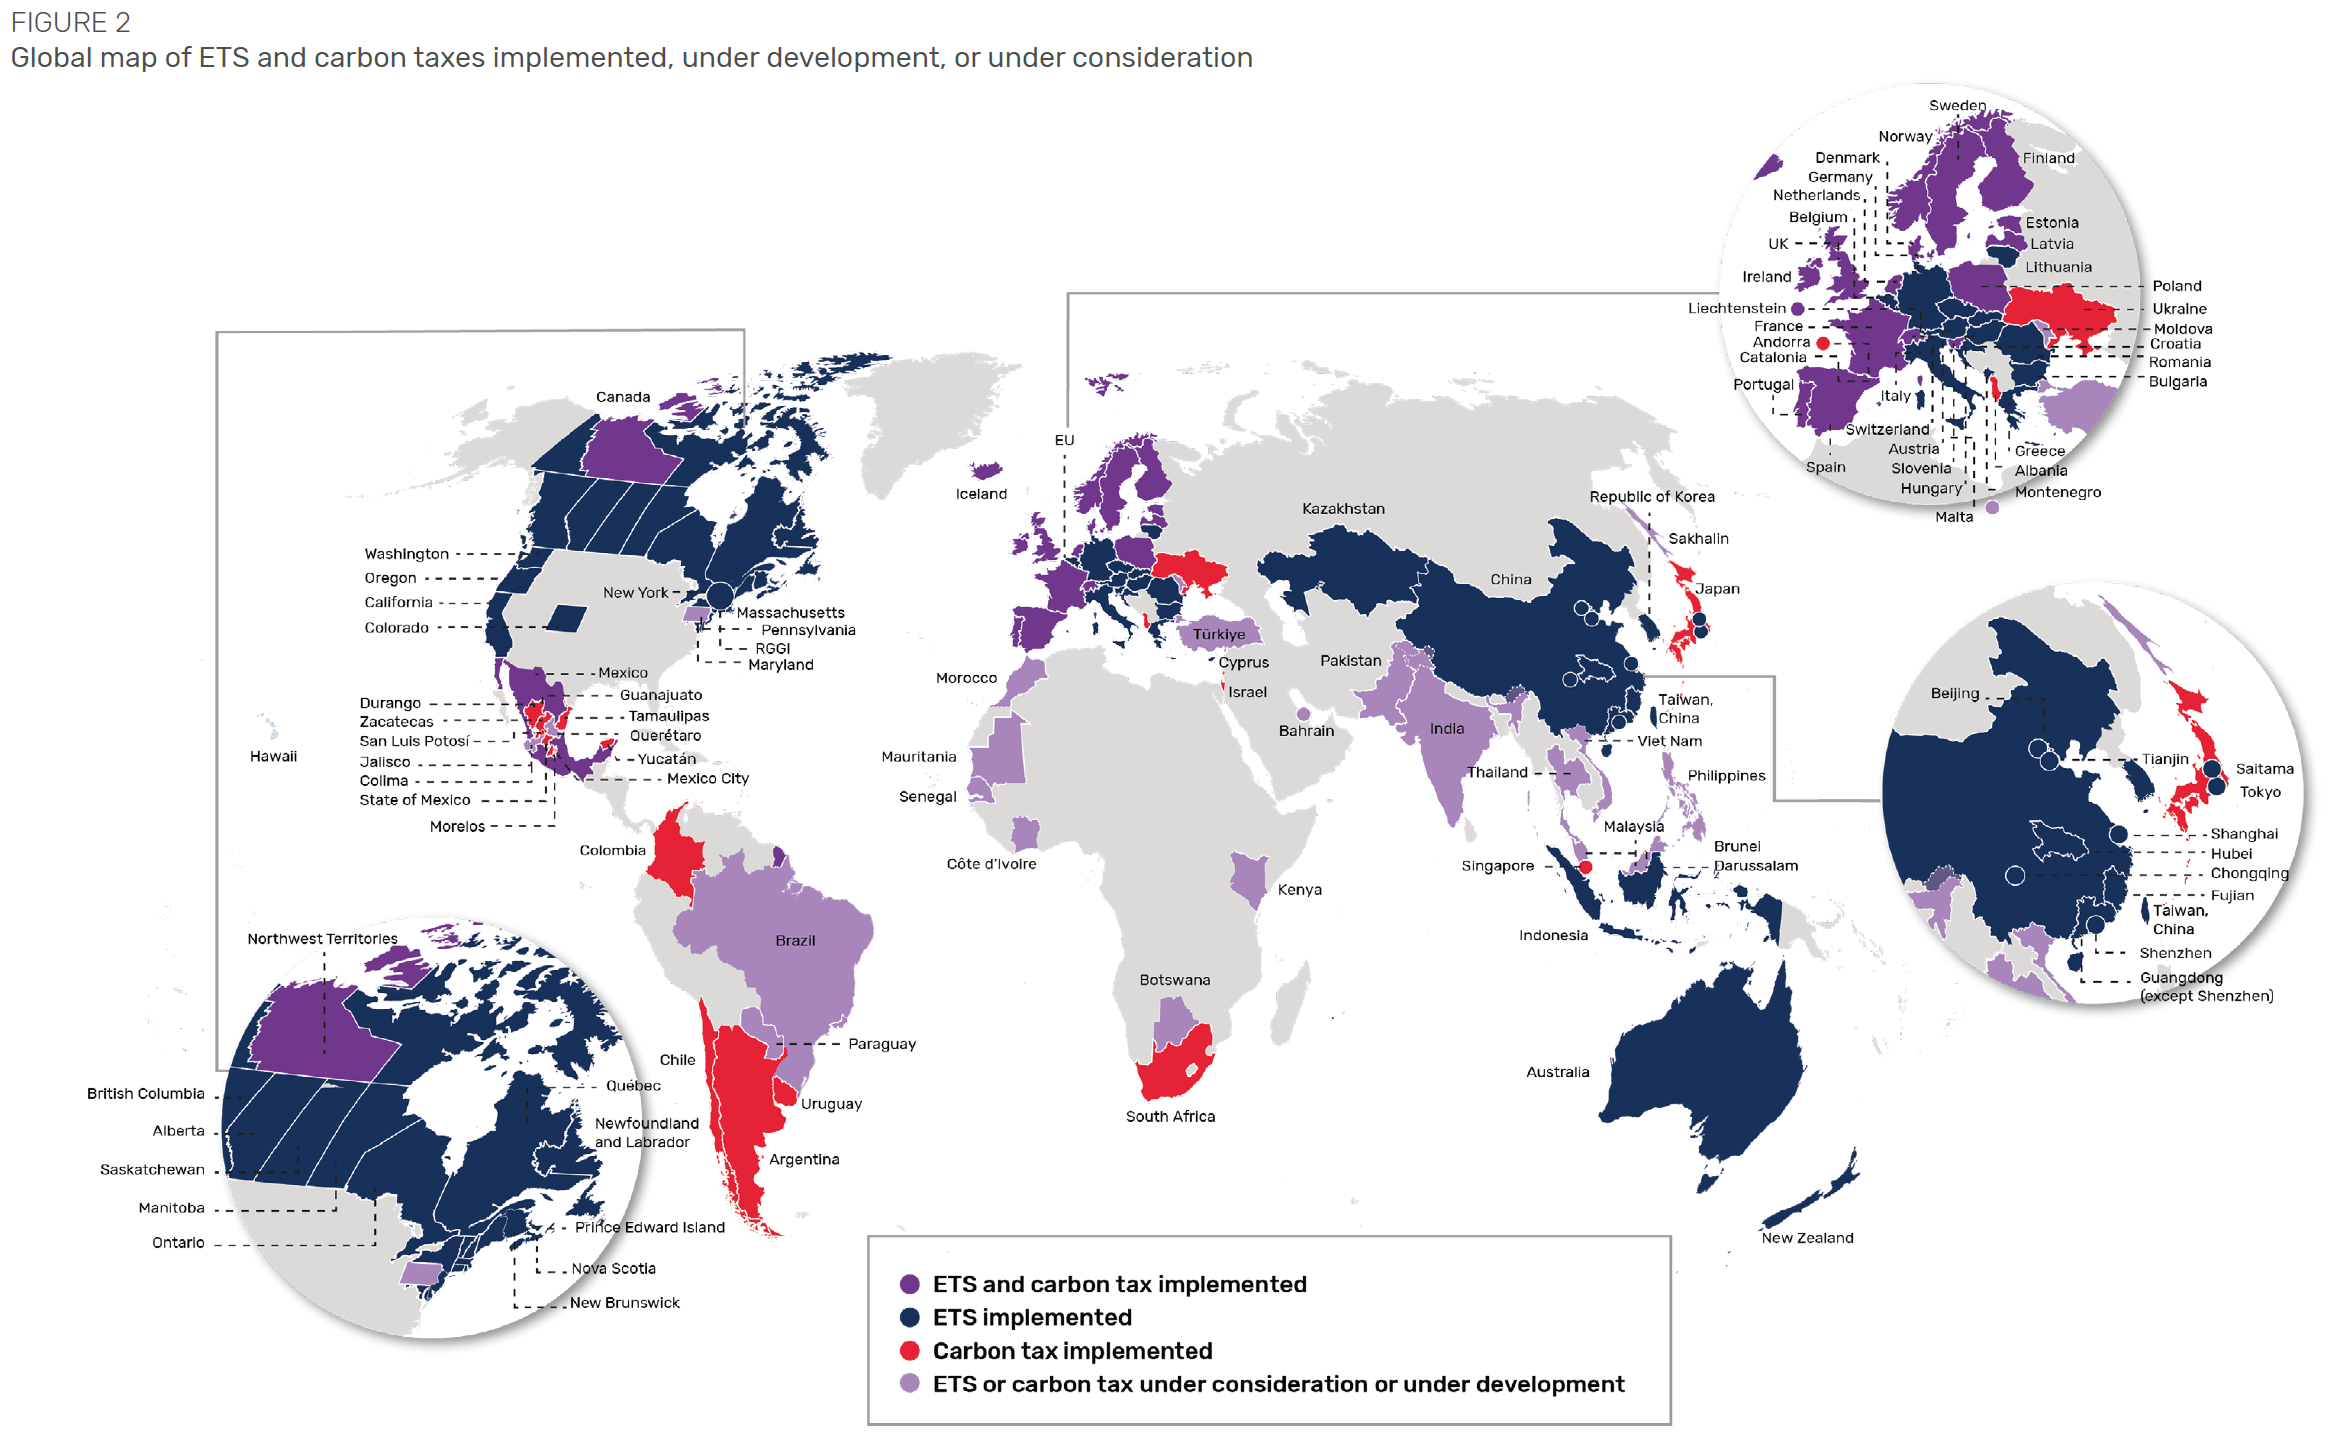
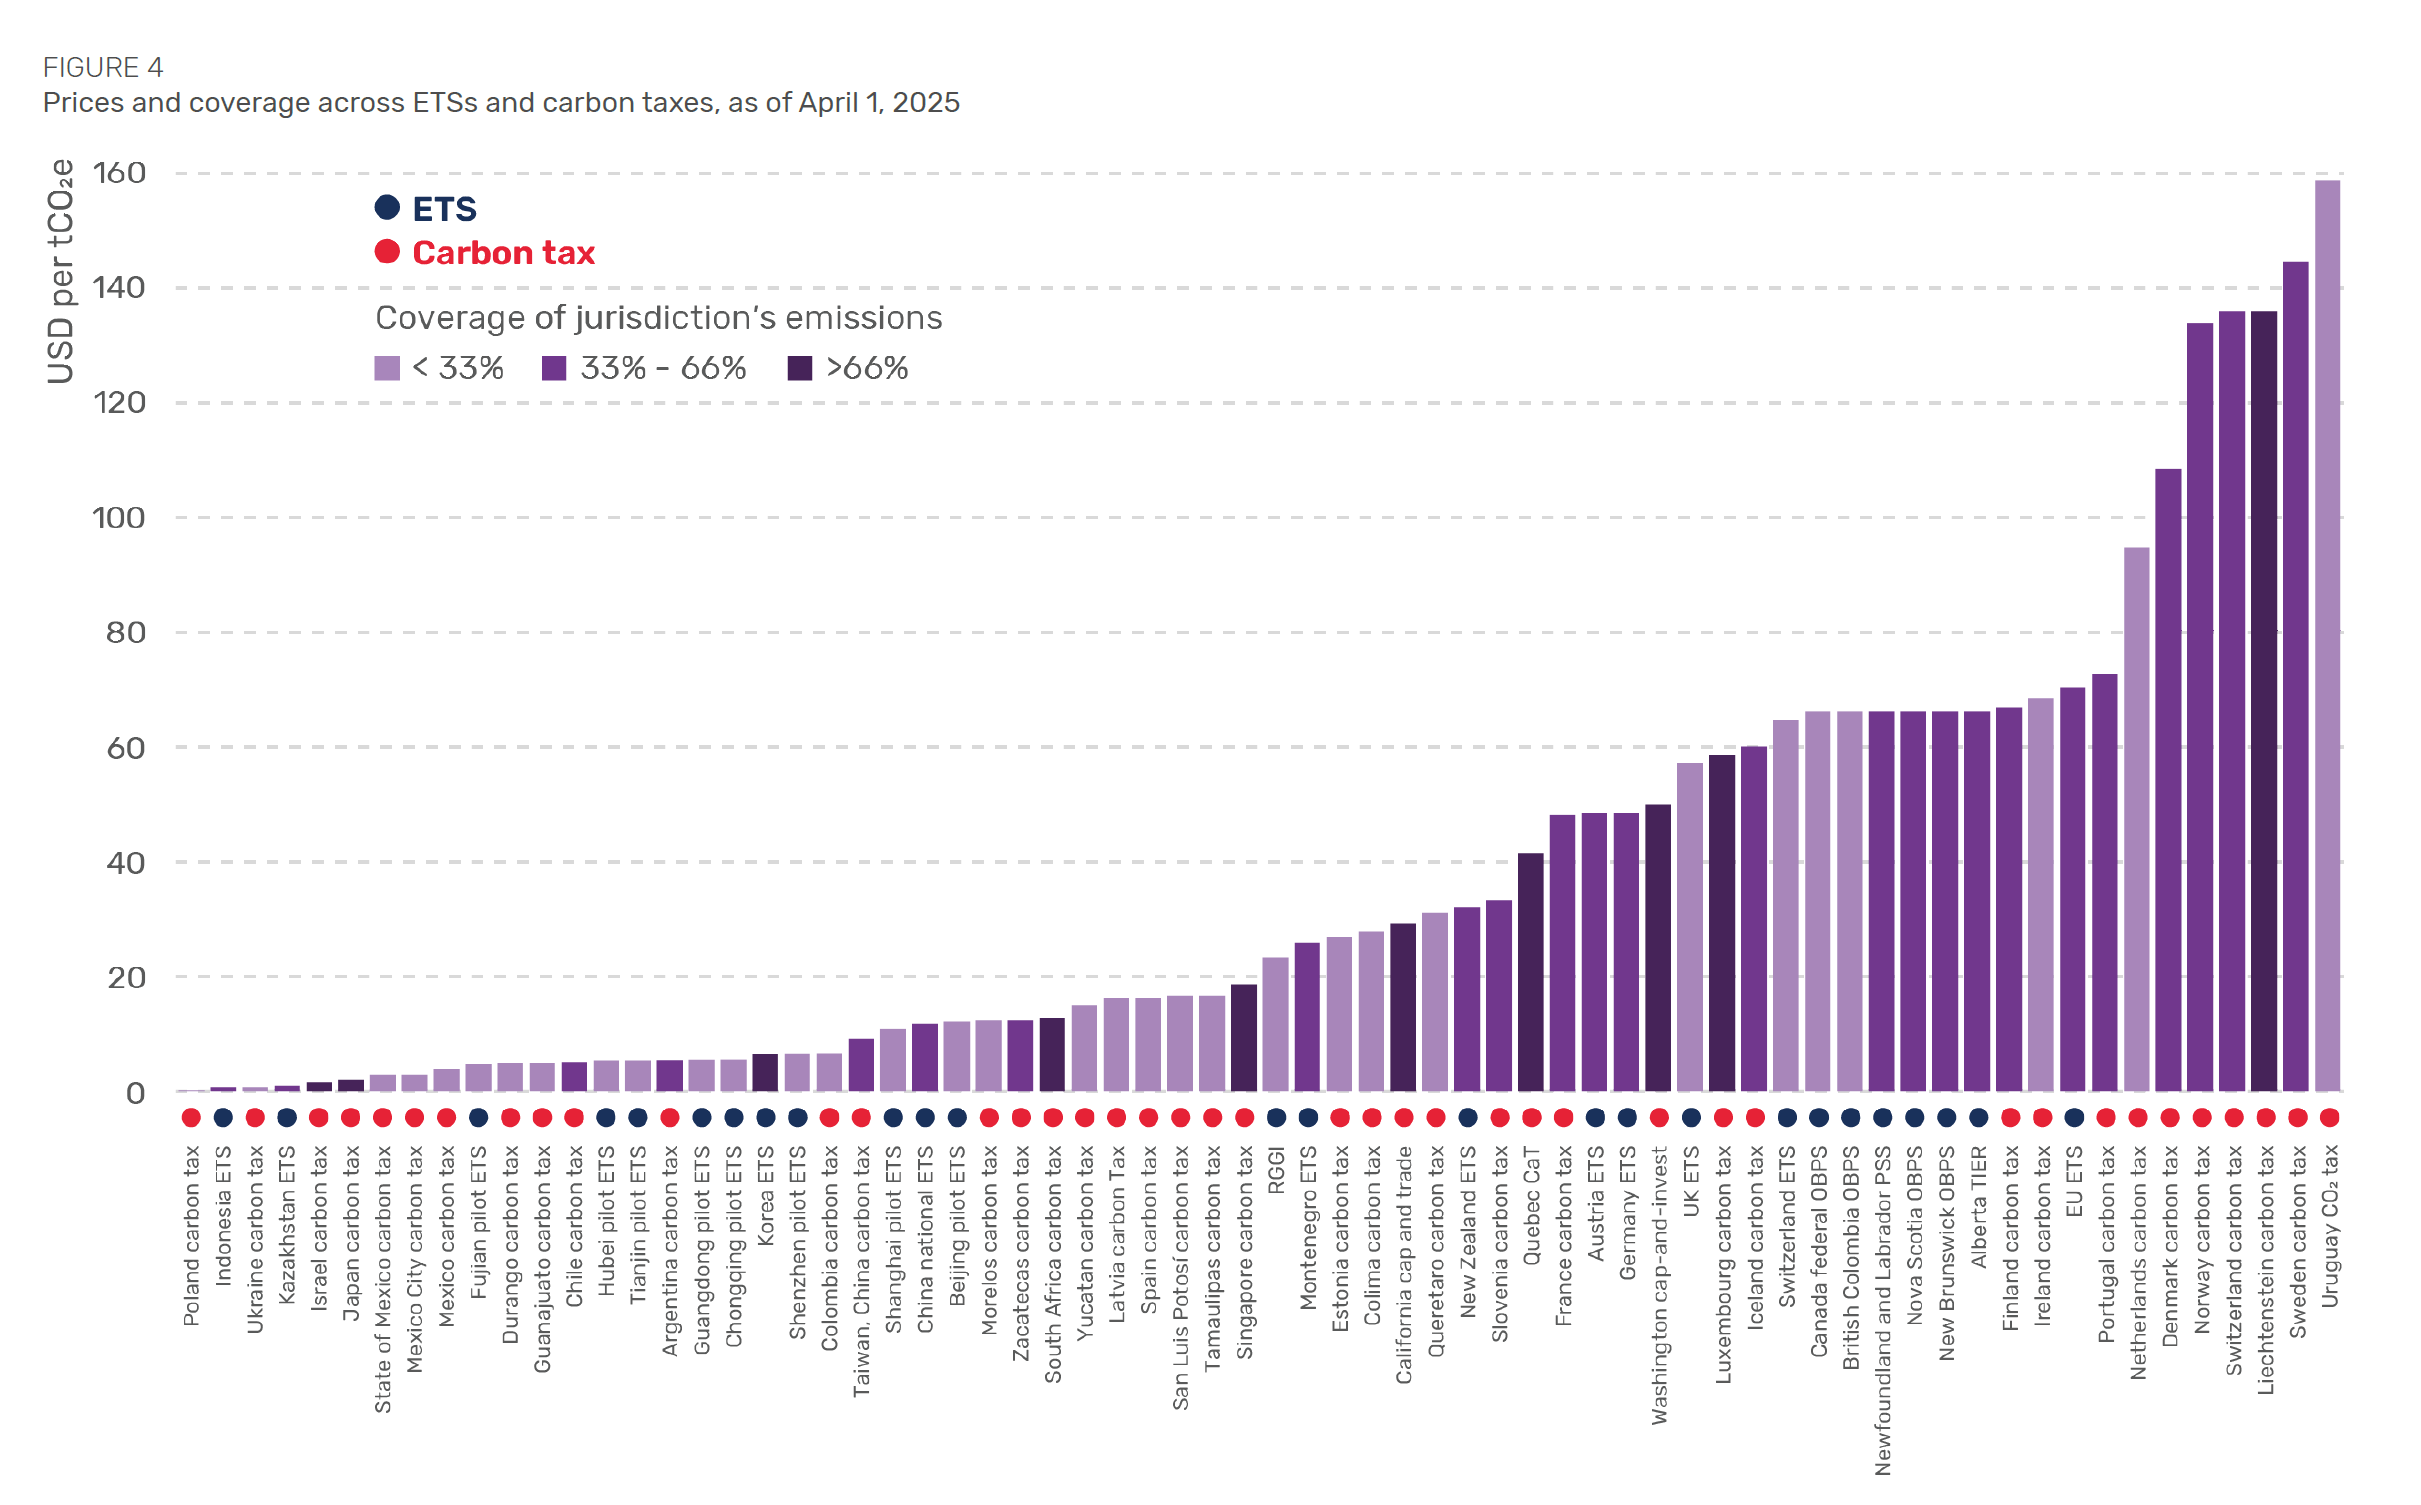
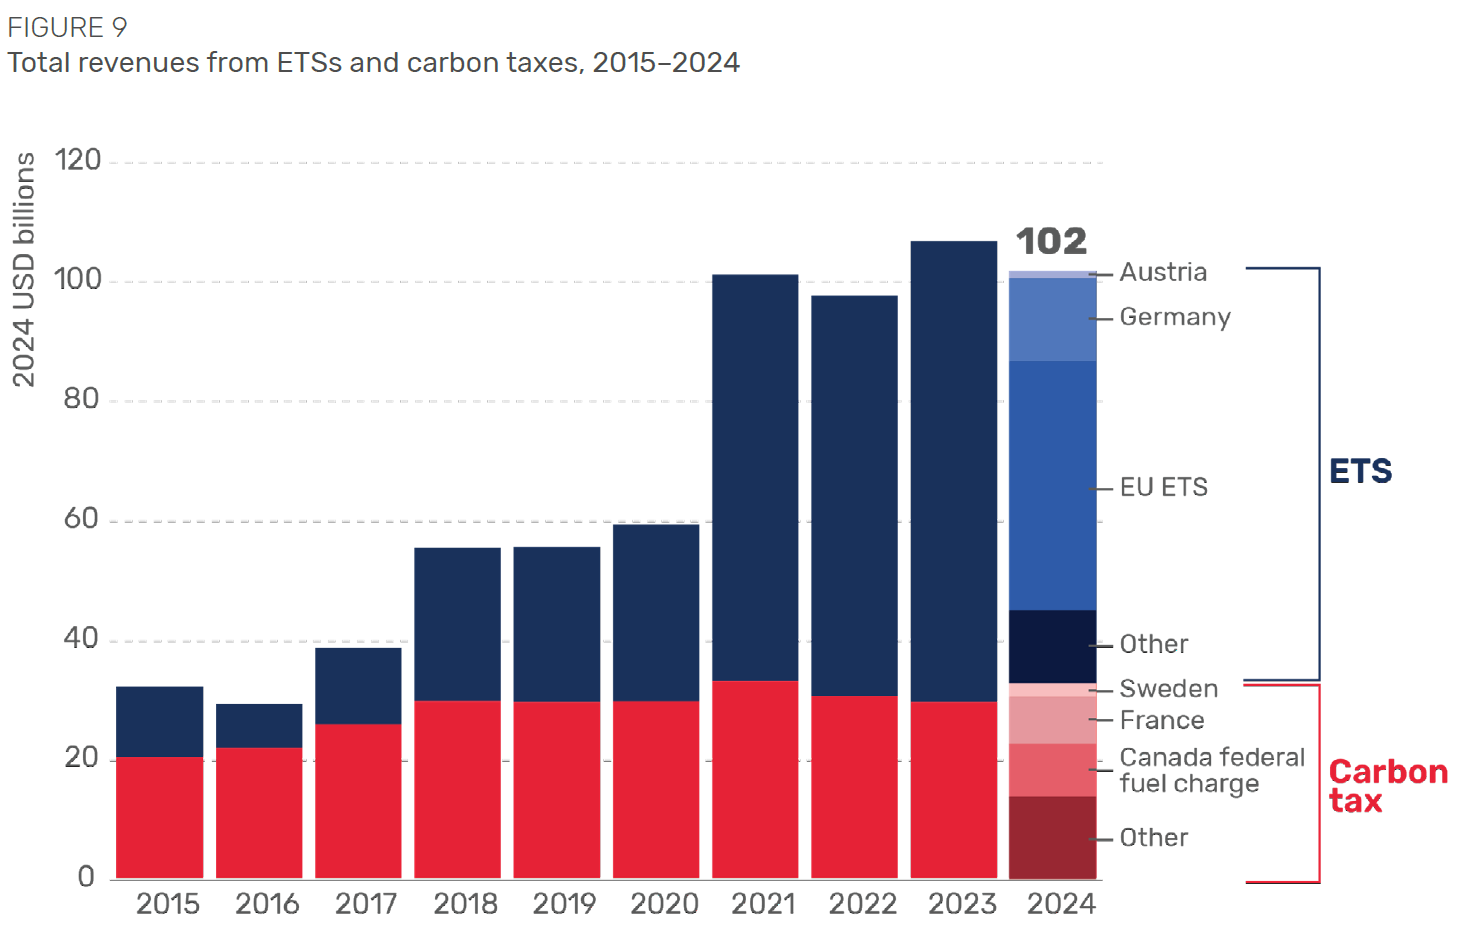
Main Carbon Markets
Stavins, R. (2019). The Future of U.S. Carbon Pricing (NBER working paper No. 25912)
Adding one important argument:
cap’n trade is under competition jurisdiction (technical, non qualified majority, not taken in account in tax burden) when taxes are under finance committees
easier to decide and vote